Treading water
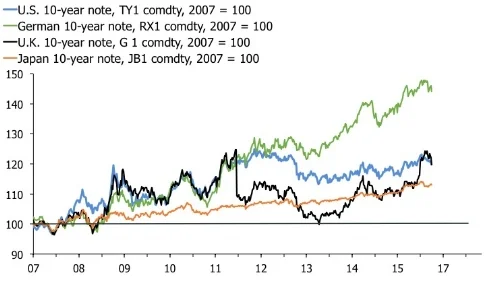
Last week was docile compared with the fun and games we were treated to earlier this month; no imminent Lehman moment at a major European bank and no flash crash in the GBP or other G4 currencies. Still, we had a number of interesting moves in the major asset classes and indices. The continued squeeze in yields probably was the stand-out move. Starting with the benchmark, the U.S. 10-year yield broke range and a move to 2% is starting to look like a good bet in my view. For once, it appears that can we apply relatively plain-vanilla macroeconomic narrative here. Inflation in the U.S.—and indeed globally—is nudging higher and the Fed intends to act accordingly. The slightly more cynical interpretation is that the Federales are desperate to get another hike in before the end of the year, but that underlying fundamentals haven't really changed that much. In other words, the question is whether investors are getting ahead of themselves in their expectations of higher rates in the U.S. I said last week that I think markets are underpricing inflation risks, and I stand by that call. Producer prices in China are now rising year-over-year, core inflation is increasing as it is supposed to as a lagging indicator, and energy prices are normalising quickly due to base effects from last year's crash in oil prices. Markets shouldn't be "surprised" by any of this. But when investors have been focused on deflation risks for as long as is the case now—and hunting yield in obscure places as a result of record low benchmark yields—an inflection point can still ruffle a few feathers.
Some commentators' comparison with the 2013 Taper Tantrum, though, is way off I think. Technical "support" and "resistance" levels, like beauty, tend to lie in the eye of the beholder. But for now, the burden of evidence remains on yours truly and others calling for an end to the bull market since 2007, let alone the really big run since the 1980s. That said, the whispers of another Taper Tantrum tell an interesting story. If the recent move in global bonds constitute a tantrum, then how the heck will markets cope if yields really move? Or maybe the comparison with the 2013 calamity is a sign of just how one-sided bond markets have come? No matter what explanation you lean towards, I worry that this market is ripe for an accident.
Carry on and keep buying duration?
The jump in U.K. 10-year yields has been especially in the spot light for its association with the collapse in sterling. In short, investors see it as a signal that foreign investors are demanding higher yields to finance U.K.'s external deficit in the wake of increased uncertainty after the referendum. Let me be clear; I agree with that analysis, but only conditionally. The real bogeyman in a balance-of-payment crisis is the bear-flattener that occurs as front-end debt sells off faster than long-end bonds, which can happen for one of two reasons. Firstly, it could be because foreign capital are discounting a very quick deterioration in domestic economic conditions, and funding dynamics, and are unwilling to lend short term without significant compensation. This is what happened in the EZ periphery in 2012. Secondly, it could be because the central bank is forced, or is choosing, to jack up rates to invert the domestic yield curve to stall the economy and correct the external deficit. This is what happened recently in Brazil and India. Very often, it is a combination of the two.
At the moment, the U.K. yield curve is steepening which seems to suggest that the repricing mainly is due to a rise in inflation expectations due to the weaker currency. That doesn't mean that higher borrowing costs aren't a sign of stress, but it does suggest that we aren't in full-on BOP crisis mode, yet.
The price action in equities remains rather boring at least if you look at the main indices. Bears emerged victorious last week as Spoos slid 1.2%, but the market stayed within the tight range it has been trading in since July. Further weakness this week would suggest break to the downside, but you are buying if you believe the range will hold. I suspect the equity market as a whole will release lower—as argued here—but I concede that the price action so far seems to suggest that the market has decided to work off its overbought conditions by moving sideways. In addition, sector divergence remains a key story. I know this seems like a trivial point, but in a world where sentiment swings between the belief in a ZIRP fuelled bubble that will take Spoos to 5000 and a Hussman-like catastrophe that pulls it back down to 666, it has been a good strategy to cut away the extremes.
Seasonality is a challenge for the bears, given that U.S. equities traditionally push higher towards the end of the year. But I am not sure this is a relevant argument this time around. Last year's price action suggest that the traditional seasonal pattern was knocked off its perch last year. In 2015, the equity market swooned in September and August and then rallied. But it peaked in the beginning of November before falling pretty much uninterruptedly into Christmas, which led to the crash in January. A similar move this year—which by no means is guaranteed—would suggest that betting on historical seasonality isn't a good idea.
In addition, U.S. elections still loom as a source of volatility in my view. I realise that locker room gate appears to have definitively destroyed Trump's chance of winning, but colour me very sceptical of the idea that this is done and dusted. I fear that the views Mr. Trump represent are shared by a big silent majority, and that it will be closer than we expect. In other words, I am not willing to rule out that the U.S. is in for a Brexit moment of its own.
A look at market indicators reveals weakening breadth in the U.S. large cap index as one of my main worries. The smoothed ratio of new highs vs new lows remain has been stuck below zero for a while now, which suggests that the market is on thin ice here. I have no evidence to suggest that we are staring a deep diving crash in the face, but risk-reward doesn't favour adding equity exposure here.

Internals in U.S. equities are looking shoddy
Elsewhere, the put/call ratio on Spoos is neutral and stock-to-bond ratios are not generally stretched. As for flow/sentiment data I have pretty much stopped looking. You can cherry pick and torture the data to come up with any message you want as far as I can tell. In fairness, indicators built by people I consider to be the smartest in the industry suggest upside risk to equities relative to bonds. Getting this call right, however, will be scant consolation if equities and bonds fall in unison.
Finally on equities, a static valuation score based on P/E, P/B and P/S ratios suggests that value is still hard to come by in global beta. This means that you either have to build a case for continued multiple expansion or a significant improvement in earnings to chase the market here. Both would seem difficult propositions given where we are in the business cycle, although I accept the notion that emerging markets could be different here. I haven't really paid that much attention to incoming Q3 earnings, but the main theme appears to be modest beats of low baseline forecasts, which doesn't really suggest that the fundamentals for profitability have changed much. Indeed, my old colleagues at Variant Perception are telling a convincing story that the cyclical highs of corporate profitability, in the U.S. at least, are well past us.

Where is the value?
Static valuation scores, however, mask the unfortunate reality that multiples don't mean-revert over time. That is an obvious problem when trying to compare past valuations to provide signs of peaks of troughs in real time. On the MSCI World, the price-to-sales ratio is the closest we get to a mean-reverting indicator in its raw form. And the story isn't exactly encouraging for investors. Valuations are now similar to in 2006/07, you would need to make an argument for a repeat of the Dotcom bubble to argue for significant further upside. That's possible but the chart below does support the overall story that we are late cycle, and that equities are close to being "fully valued."

The bar is high for further multiple expansion
Meanwhile, FX markets provided a timely answer to my question last week on how long the EURUSD could remain in its right range. The pair decisively broke to the downside, closing the week just shy of 1.10, and the chart indicates traders are now drawing lines and extrapolating to the post-QE lows 1.06. A more interesting question, though, is whether Bucky is about to go on a more sustained bull-run in the next couple of years. Markets like to talk about this scenario only as a function of what the Fed is doing, and how global monetary policy divergence gradually will drive FX markets. I am sympathetic to this view, but it also has a break built into it. By this story, the FOMC is constrained by ZIRP and QE in the rest of the world, which tends to push the dollar substantially higher even if the Fed only moves a little bit. The end result is a timid Fed that acts with an eye to limit currency appreciation. I am a strong believer in the idea that excess liquidity and current account surpluses in rapidly ageing economies push down long rates in the rest of world. But after the GBP's spectacular collapse following the Brexit referendum, and the dark clouds of political uncertainty gathering over Europe as a whole, I think the Fed might just get a USD bull market no matter what they do. In which case they might as well go on and do what it is that they would like to do anyway.
Finally, the rally in crude oil stalled last week at the upper end of its range close $50, and the ratio of noise to signal amidst discussions of speculative positioning, inventories, and OPEC production planning has surged. My gut feeling is that the pain trade is up, which is partially based on the argument above that global inflation risks are underpriced. Gut feelings can be a dangerous ally in financial markets, though, but ETF flows do appear to offer some support for the idea that oil prices can push higher in the short-term. If they do, it would translate quickly into further inflation "surprises" and, arguably, more angst for bond investors.
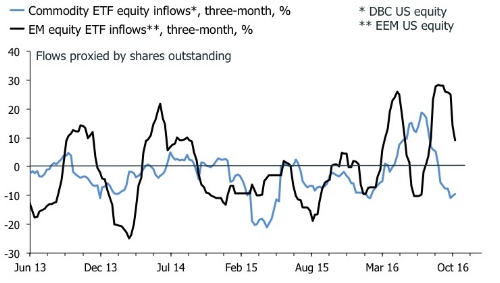
Short EM equities, long commodities in Q4?
The alternative is that oil takes a break and squeezes vol buyers for a while. When investors are positioning for a big move in either direction, the market often acts non-compliantly by simply treading water.