Are markets really that boring?
Traders and strategists on Bloomberg TV had one overarching message last week. It's boring out there, too boring. John C. Bogle's Vanguard and Larry Fink's Blackrock have turned passive investing into a volatility crushing monster. Indexation is an immovable force, which takes no prisoners, evidenced by the fact that the return on the main U.S. stock indices is driven almost exclusively by five major names. Trying to beat the tide by picking stocks—both long and short—is proving nigh-on impossible for active managers. Adding insult to injury, the bond market is a snoozer too. The curve can't figure out whether to steepen or flatten in response to the Fed' slow hiking cycle—I am betting on the latter—and yields have been range bound as a result. Clearly, investors aren't easy to please. When volatility is soaring, they assume foetus positions and cry for central banks to rescue them, and when low volatility finally arrives they deplore the lack of opportunities. Maybe it is just a question of the porridge being neither too hot nor too cold, but when punters start complaining about low volatility my spider sense goes off.
In this situation, the only reasonable thing to do is to run a small study to see whether in fact low volatility begets complacency and weak returns for the equity market. I suspect everyone is doing these at the moment, so let's throw down a benchmark via a study by Deutsche Bank referenced here by FT Alphaville.
The result is just as boring as the general market environment;
So in conclusion ultra low vol doesn’t necessarily predict bad returns going forward but returns are generally higher when vol starts at a higher point than current levels or when it is ultra high. Quite high but not ultra high tends to be the worst starting point. There is therefore some evidence that future returns from this starting point might be sub-trend but no particular evidence of an imminent big problem looking at the historical data alone.
FT Alphaville's David Keohane doesn't seem impressed, but the question is whether I can do better. My initial inspection of the numbers doesn't really yield much. No matter how much I torture the data, I can't produce a framework which links a "low" VIX to lower equity market returns. The sample size is uselessly low; for example, it is the first time since 2008 that VIX has dipped below 10. In other words, it is impossible to verify whether a single-digit VIX is a sell signal within a context of this bull market. We will just have to wait and see. It doesn't get much better if we massage the thresholds a bit. The first chart below shows a binary indicator, which triggers when the VIX falls below 10.5 and rise back above that level.
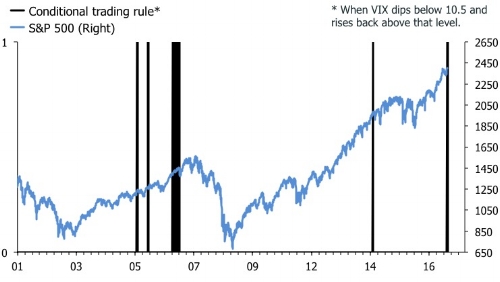
It is the second time since 2008 we have such occurrence in the VIX, and we have had a total five since 2001. Bears will note that this signal tends to go off in the mid-to-later stages of a bull market, but this is scant consolidation. Ultra low volatility in itself does not ring at the top of the bull market. That said, the last time this signal went off—September 2014—it did flag a wobble in the S&P 500, which ended with a 10% sell-off. But statistically speaking, it isn't easy to support the idea that the current low value of the VIX is an indicator of lower equity returns.
I won't yield this easily, though. One of the key statistical characteristics of the VIX is that it is highly autocorrelated, a feature it shares with many other financial time series. In short, one of the best predictors of the VIX tomorrow is the VIX today, and movements tend to be persistent. This is to say that low volatility begets lower volatility and vice-versa with high volatility. If we want to capture any underlying signal from the VIX, we need to correct for this. In order to do this I ran an AR(2) model for the VIX with 2770 daily observations—which explains a whopping 97% of the variation in the VIX—and had a look at whether the error term contains some valuable information.
The chart below shows instances where the VIX at t=0 is more than three standard deviations higher than the value predicted by the values in t-1, and t-2. The intuition is that if the VIX is "running" away from the prediction based on an AR(2) model, it signals danger ahead.

This signal looks more promising, although it isn't going off now. It appears to go off before or in the early stages of severe sell-offs. It has gone off six times since the 2008, and in five of those occasions it has been a decent signal to get out of the water. The challenge with this type of signal, however, is that even slight slippage means that it could well be less useful than it appears in a backtest or via visual inspection. After all, if it goes off in the middle of a sell-off, it is difficult to argue that it is a leading signal. That said, I think the idea is sound. If you want to get the best of the VIX as a market-timing indicator, you need to adjust/correct for the fact that it is highly autocorrelated.
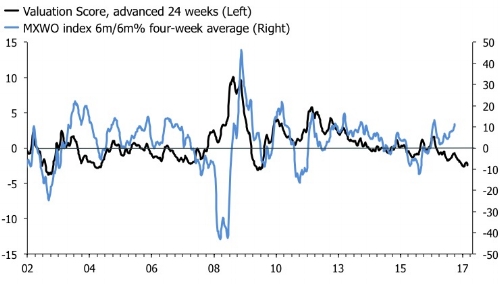
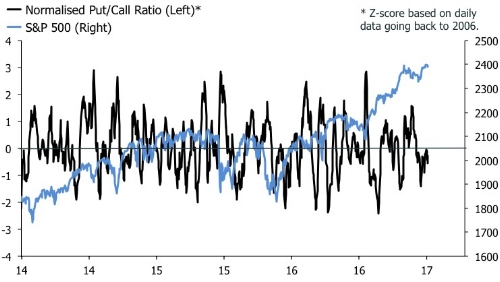
As for other equity market indicators, my headline models suggest that I should be worried. Trailing returns on the MSCI World are running far ahead of my valuation score and momentum in my global leading indicator. In addition, the put/call ratio on the S&P 500 has been persistently stuck below zero since the beginning April. Investors, it seems, are not too impressed with the idea to sell in May and go away.

This headline story, however, ignores numerous specific themes, which tell a more nuanced story. In the U.S. for example, the unchallenged push higher in big U.S. tech names remains impressive as ever, while other parts of the market are struggling. Just look at the ongoing carnage in U.S. department store and retail stocks, and the looming glut of returned lease cars weighing on auto manufacturers and lease companies. In Europe, the euphoria has been turned up a notch following Mr. Macron's victory and the market has so far been in a generous mood. I think the move is overdone, but the underlying bullish story has certainly become more credible after the French elections. Finally, emerging markets also have been doing splendidly. Nothing to see here then, or is there?
Chinese whispers of an accident in the making?
Last week I asked whether investors should worry about low oil prices and signs of an impending slowdown in China. I came out in favour of keeping calm and carrying on, but the evidence is building against this sanguine interpretation of events. The Chinese yield curve inverted last week—in 5s10s guise—adding to the evidence that financial conditions are tightening at a record pace.
In emerging markets, a yield curve inversion is a classic sign of a slowdown, and usually happens in the context or capital outflows and/or sharp currency depreciation. If the central bank targets inflation—and especially if the economy runs a current account deficit—it will be forced to jack up short-term rates and invert the curve, forcing a sharp cyclical slowdown. Recent examples of this include India and Brazil.

Let's be clear about one thing then. China does not fit the textbook case above. The economy runs a current account surplus, which gives the PBoC much more control of rates across the curve. A yield curve inversion could be a sign that capital outflows were accelerating, and essentially that current account dynamics were deteriorating far quicker than suggested by headline data. But I doubt it. In that case, the CNY would be cratering—which it isn't—and China would be shedding reserves. In other words, this would be an uncontrollable event. It does not appear to me that this is where we are the moment, and headline risk asset indices corroborate that story, at least for now.
That said, this is clearly a sign that the PBoC is getting more serious in its attempt to curb activity, especially in China's off-balance sheet/shadow banking sectors, which are as opaque as Mr. Trump's Sunday morning tweets. Per the FT linked above, the PBoC is tightening regulation and withdrawing liquidity from money markets. The latter is probably the main reason why front-end rates are jumping. But the FT also makes the valid point that yield curve inversion also reflects supply/demand dynamics. With the PBoC clamping down on short-term funding, China's large money managers have taken the hint and sold off in their portfolios of short-term bonds. The rules of bond investing suggest, however, that if this is the main driver of the inversion, it won't last long. After all, why settle for 3.5% over ten years, when you can get 3.6% over five?
The only question we need to answer then is whether an inverted yield curve in China actually matters at all? The chart below shows instances since 2011 when the 5s10s has been inverted overlaid on the MSCI EM.

I suspect bulls and bears will be fighting over this one. China bulls will point out that the Chinese yield curve is very volatile, and to the extent that it does invert it often happens after the fact with respect to equity market weakness. If that is true, we should be buying EM/Chinese equities when the curve inverts. Bears, however, will note that on the two most recent occasions an inversion of the 5s10s happened during or just before sharp sell-offs in the MSCI EM. The only fair conclusion probably is that a Chinese 5s10s inversion is not a sign of anything on its own. But in combination with weakness in commodities, and the inevitable coming plunge in producer price inflation, it paints rather worrying picture of the near-term cycle in China. This story also comes at a time, however, when China is busy developing the new Silk Roads, which is a very bullish story for the region, at least in an economic sense. With that story in mind, you could also argue that whatever wobbles we see in the short term, a Chinese government playing the long game is the real, and rather upbeat, story.
The analysis above shows that even the combination of a very low VIX and an inverted Chinese yield curve is not enough to provide a statistically significant signal to sell the market. But perhaps it suggests that investors should be careful what they wish for. After all, a boring market probably isn't the worst thing that can happen to your portfolio.