Just what the doctor ordered?
Weaker oil prices, a Fed rate hike, and Geert Wilders' anti-EU party swooping in as the second-biggest party in the Dutch parliamentary elections. You would have thought that these events last week would have been enough to scare investors. But headlines can be deceiving. Despite the weakness in oil, the price hit strong resistance at its 200dma, and snapped back in the latter part of last week. The tone of Mrs. Yellen's statement was just right to maintain markets' faith that the Fed will only gently push borrowing costs higher. In other words, risks assets wanted a dovish hike and decided that this is what they got. And finally, the key story in the Dutch elections was not that Mr. Wilders made headway. The main theme was the victory of the incumbent Conservatives, led by PM Mark Rutte, and that support for the centrist pro-EU parties soared. Mr. Wilders and his hopes to engineer a Dutch exit would appear to have been dashed, at least for now.
As a result, equities pushed higher yet again last week. The S&P 500 was up 0.5% on the week, but the MSCI World beat Spoos with a 1% gain due to strong performance in emerging markets. In other words, the slow grind higher persisted. If I was forced to use only one chart to describe the environment in equities, I would choose the following—from my IRP colleagues at Bespoke—which states the obvious; sell [U.S.] equities at your peril.

The corollary to the chart above is that equity volatility has been crushed on all horizons, and in all the major benchmark indices. This has confounded investors and analysts in light of soaring political uncertainty. How many times have we not seen the chart with VIX overlaid with the Baker, Bloom and Davis political uncertainty index, implying that equity volatility is about to shoot higher. Maybe this comparison, however, is not as accurate as we think it is. Bloomberg macro strategist, and former expert macro blogger, Cameron Grise took this particular question to the data last week [1], and his findings are interesting. Mr. Grise de-composed the BBD index in its news component—the part based on the news media text mining algo—and the non-news component, which captures dispersion of economic forecasts and expiring fiscal policy measures. Cameron makes two key observations.
He shows that the trend in the "non-news" component of the policy uncertainty index is near post-crisis lows, despite the flurry of changes and non-changes in policy being announced in Washington. Based on that observation he concludes that a low VIX isn't that odd. The coup de grace, however, is his finding that the "news" component of the BBD index is a much weaker measure than the "non-news" component in terms of its ability to explain the economic data. Indeed, since the financial crisis he finds that the "news" component has shown almost no correlation with economic output in the U.S. A score for the investigative and myth busting macro researcher then.
The findings fit my bias, and I would even venture a more fundamentalist interpretation. It is increasingly clear to me that "political uncertainty" has been one the main tailwinds to markets. It has manifested itself in an almost perfect balance between systemic risks—EZ break-up, trade war and even real war—that never emerge and the expectation that financial conditions will remain loose to counter the eventuality of said risks. After all, fiscal and monetary policy remains primed to do more, or to only tighten very slowly to avoid an accident. The reflexivity here is complicated, but I think it has been a powerful tonic for keeping enough investors on the sidelines, and for keeping punters with long positions nervous enough not to go completely overboard.
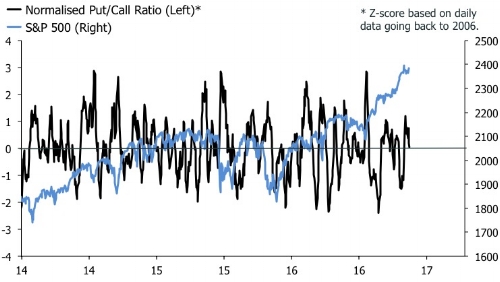
The put/call ratio is an interesting case in point. A long period without a drawdown usually is associated with investors scrambling to position for further gains via call options. But we so signs of that. The next chart shows the normalised put/call ratio on the S&P 500 and it is exactly at its 11-year average of 1.
We'll soon get some evidence to test my hypothesis. Market folklore has it that if Marine Le Pen snatches the French presidency, chaos will ensue. I share that sentiment, but the short-term chaos likely will quickly be replaced by the realisation that a Le Pen victory immediately resets the clock for the parliamentary elections in the summer. Assuming that Front National does not get a majority, which it almost surely won't, it will be very difficult for Mrs. Le Pen to engineer referendums to take France out of the EU and the EZ. In addition, if Le Pen carries the day, the ECB likely would dial back the timing of policy "normalisation" even further than it already has. By contrast, a victory for Emmanuel Macron is seen as the perfect outcome for markets, but it if that happens it also means that that the ECB doves will lose one of the main arguments for aggressive policy easing. At least, I think there is a risk the market could quickly pivot to that interpretation, and then the issue of record low yields in all things fixed income related suddenly becomes a story.
All eyes on oil to gauge the next accident in credit?
If investors don't want to get their knickers in a twist over political uncertainty, they could probably do worse than simply looking at the oil price. If oil finds support here and pushes back into range, I think people will forget about it quickly. If it doesn't, however, things could get interesting. At a first glance, I should benefit from a lower oil price. The next chart shows that a decline in the oil price [2] should hasten the mean-reversion in cyclical vs defensive equity market performance, and likely also push long-term rates lower. These are both trends that would do nicely for the portfolio, which has started to stretch its legs a bit.

A more unruly drawdown in oil, however, would rekindle fears of a crack in corporate bond markets where investors have continued to blindly pile in in their increasingly desperate search for yield. I have been writing about this theme before, and I think it deserves more or less constant watching. The next big crisis will not come because of a existential threat in Europe or a hard landing in China. The next big blow-up will be ignited in the corporate bond market where the mismatch between evaporating liquidity and crowded investor positioning is an accident waiting to happen. My main worry is that it will spread to fund providers such as Vanguard, Blackrock, Templeton, EFTS etc, which have showered financial markets with their ETF and fund products in recent years. I have nothing against this or these firms per se. Indeed they have been key drivers of innovation in the financial services industry since the crisis, and largely for the better. Just remember that central banks' liquidity guns are pointing at banks, not these new shadow financing players and I think this could come back to haunt us if financial conditions tighten materially.
I have been worrying on and off about this since 2013, though, so I wouldn't necessarily run for the hills just because I am writing about it again. I thought we were off to the races when oil crashed to $20 in late 2015, but credit investors kept a steady hand and bought the dip in high yield, a move that so far has proven a profitable one. The wobble in high yield this time has so far been modest. The HYG us equity is down a 1.3% this month, and while flows have rolled over the next chart shows that they remain positive on a three-month basis.

It isn't easy to create a leading indicator for credit, mainly because spreads tend to be leading indicators themselves. If we torture the data a bit, though, we can say that spreads have tended to be coincident with macroeconomic momentum in this cycle. The next chart shows that the trend in both spreads and the six-month change of macroeconomic leading indicators remain conducive for further gains. If you squint, though, you can see that momentum in spread tightening appears to be slowing, but it is too early to say whether this will morph into something more sinister.

This is especially true when corporate leverage has increased to far beyond levels seen in previous cycles. We can say that risks are elevated, but not necessarily when the rubber will hit the road. The following chart for example—courtesy of 13D and Hedgeeye—shows that defaults in the retail sector have soared, but markets appear to put this trend into the "Death by Amazon" box, and has decided that it isn't a macroeconomic story.

I am looking at 2s5s in the U.S. as the canary in the coalmine for when financial conditions are likely to become too tight for overlevered corporates. If the Fed has to go for it I think this spread would flatten aggressively and quickly, providing the one of the "early" signals that the cycle was ending. We're not there yet, though. The spread is certainly flat in a historical context, but it's far from inversion and has actually steepened on a six-month basis.

In this context, I am comfortable with a position that is broadly long defensives vs cyclicals combined with selected investments in EM where valuations have been pushed to attractive levels by a wave of recessions. Of course, if ETF/mutual fund provider X falls by the wayside, I would be in trouble; I don't try to kid myself that I could hedge against such a scenario. Damage limitation would be the key, not making money outright. I am on record for calling a pull-back in equities since Q4 which means that I don't get to do a victory lap when the sell-off eventually occurs. All I can hope for is that I won't suffer too much. For now, though, the combination of political uncertainty that never really seems to materialise, and the put from fiscal and monetary policy pledged to remain on investors' side appear to be just what the doctor ordered.
--
[1] - Cameron writes as part of the new Markets Live blog which is only available for Bloomberg subscribers via the terminal, so I have no public link. Sometimes, though, these guys' work will find its way into the Bloomberg news reporting above the fold. I will post a link if that happens.
[2] - The y/y chart in oil assumes unchanged spot oil prices in the next five months.