The great (bear) steepening
Everyone is talking about the sell-off in bonds these days. Yields on the US 10-year benchmark is up nearly 150bp since April, within touching distance of 5%, and 30-year yields are now just over 5%, up from 3.7% in April. With the two-year yield up just 100bp over the same period, the curve has bear steepened by 50bp, and is now looking to un-invert due principally to a sell-off in long bonds, contrary to widespread expectations of bull-steepening via a rally in the front end. The 2s10s is still inverted by around 17p , but the 2s30s is now—as far as I can see from the close on Friday the 20th of October—just about positive. No wonder that the long bond is on everyone’s mind. Sustained bear-steepening during inversions are rare sights in G7 bond markets, so when they are spotted in the wild, they tend to grab the attention and imagination of investors and analysts. But what does it mean? Put on the spot, I’d say that bond market volatility is underpriced.

Volcker or the GFC?
The chart below plots the instances of 2s10s bear-steepening, conditional on an inversion, since the middle of the 1970s. I am using a six-month time frame with weekly observations. You will invariably get different results with alternative time frames and observational data. On the face of it, the message from this chart is sobering; do you want a repeat of the Volcker tightening or another 2007/08? The problem of course is that a sample size of two is no different than noise. As such, it is important to state at the outset that the signals plotted below, both pointing to the risk of step-change higher in bond market volatility, almost surely are not statistically significant on any standard measure of robustness. I have drawn the second chart, with a rough-and ready empirical measure of bond market volatility, because my sample of the MOVE index does not stretch back to the 1970s.

Bond volatility is already elevated, but it can rise further
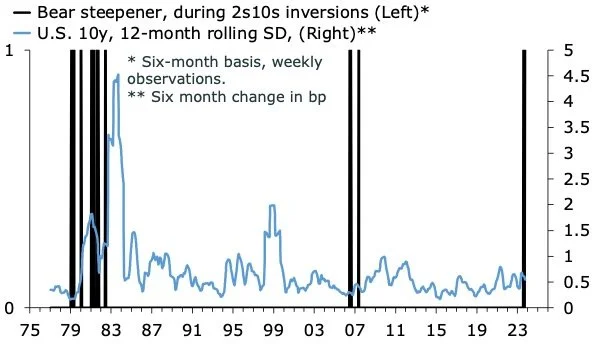
The calm before the storm?
And to cap it all off, here is a chart with bear-steepening, conditional, on inversions alongside six-month equity returns in the U.S. Not surprisingly, bear-steepening during inversions have in the past been correlated with significant volatility.

A low sample size, but ominous all the same
How to think conceptually about a bear steepener during inversions
Looking beyond empirical analysis trying to pin down the significance of a bear steepener during inversions, a vigorous debate about the term premium, and whether it can explain the recent rise in long-term bond yields, also is now underway. To re-cap: one way to think about the long-term bond yield is to decompose it into two components; an expectation for the policy rate over the duration of the bond in question—i.e. a big part of the yield on a 10-year bond will reflect expectations of short-term interest rates in ten years time—and a (term) premium for holding long-term bonds over short-term bonds made up principally of compensation for lower liquidity and duration risk of long-term fixed income instruments. In order then to capture the term premium, you would first need to establish a benchmark for the prediction the of short-term interest rates—either market or survey-based—and the difference between this measure and the prevailing nominal bond yield is then the term premium. That sounds neat, but as will be immediately clear to anyone with basic knowledge of fixed income metrics, such an analysis will be very sensitive to the choice of measure for the future short-term interest rate. The most widely used market-based indicator is yields on zero-coupon bonds—bonds whose returns are calculated when they mature reflecting a deep discount to coupon cash bonds at the point of purchase—while survey-based indicators often are derived from professional forecasters’ data. Another rough-and-ready metric for the term premium is the difference between the change in nominal bond yields and breakeven yields. This is based on the idea that if nominal bond yields are rising while breakeven yields are stable, then it has to be driven by a rising term premium. Or put differently, if markets believed inflation would be higher in 10-years time, they would also believe the short rate would be higher, and breakeven yields should increase. The challenge in applying these tools is all the more greater when the yield curve is inverted, because that in itself suggests that the term premium could well be negative, which doesn’t happen that often. This brings us back to square one. A negative term premium can be resolved in one or two ways; by a decline in market expectations for the future short-term rate, or by an increase in the term premium holding short-term interest rate expectations over the relevant time period constant.
We can approximate a link between the term premium and bear steepening, conditional on inversions, by thinking about two separate drivers of a higher term premium due to rising long-term bond yields. First, a weak form in which investors require a higher return on longer-term debt due to rising uncertainty over future inflation reflecting an environment with a lot of uncertainty over for how long short rates will stay restrictive to bring down inflation to target. A strong from in which investors require a higher return on longer term debt because they’re increasingly certain that short rates will remain a present level for a long time. In this case, the term premium has to increase to compensate for the overall uncertainty—liquidity, duration risk etc—associated with holding longer term bonds. The two are closely related, but in the second case, the rise in long-term bond yields/term premium will be more sustained. I am still undecided on how to weigh these two explanations, but whatever explanation fits your priors, the debate about the great bear steepening will continue.