Global Leading Indicators, December 2025 - Broad-based strength
The November and December 2025 edition of the global LEI chartbook can be found here. Additional details on the methodology are available here.
The disconnect between momentum in global macroeconomic leading indicators, benign conditions in financial markets, and volatile global geopolitics could hardly be greater at the moment. Granted, leading indicators will always lag the latest gyrations in global geopolitics—especially in a world where Mr. Trump is conducting the orchestra—but judging by the past 12 months, not even the potential collapse of NATO or a full-blown EU–U.S. trade war will knock risk assets off course for more than a few minutes. That is not because such events would lack significance, but because markets are now deeply wedded to the idea that Mr. Trump’s bark—on tariffs and otherwise—is much worse than his bite. Time, as always, will tell. The fundamental problem for markets is that lofty valuations and generally exuberant investor sentiment mean that any repricing in response to a less optimistic view of the world would be violent.
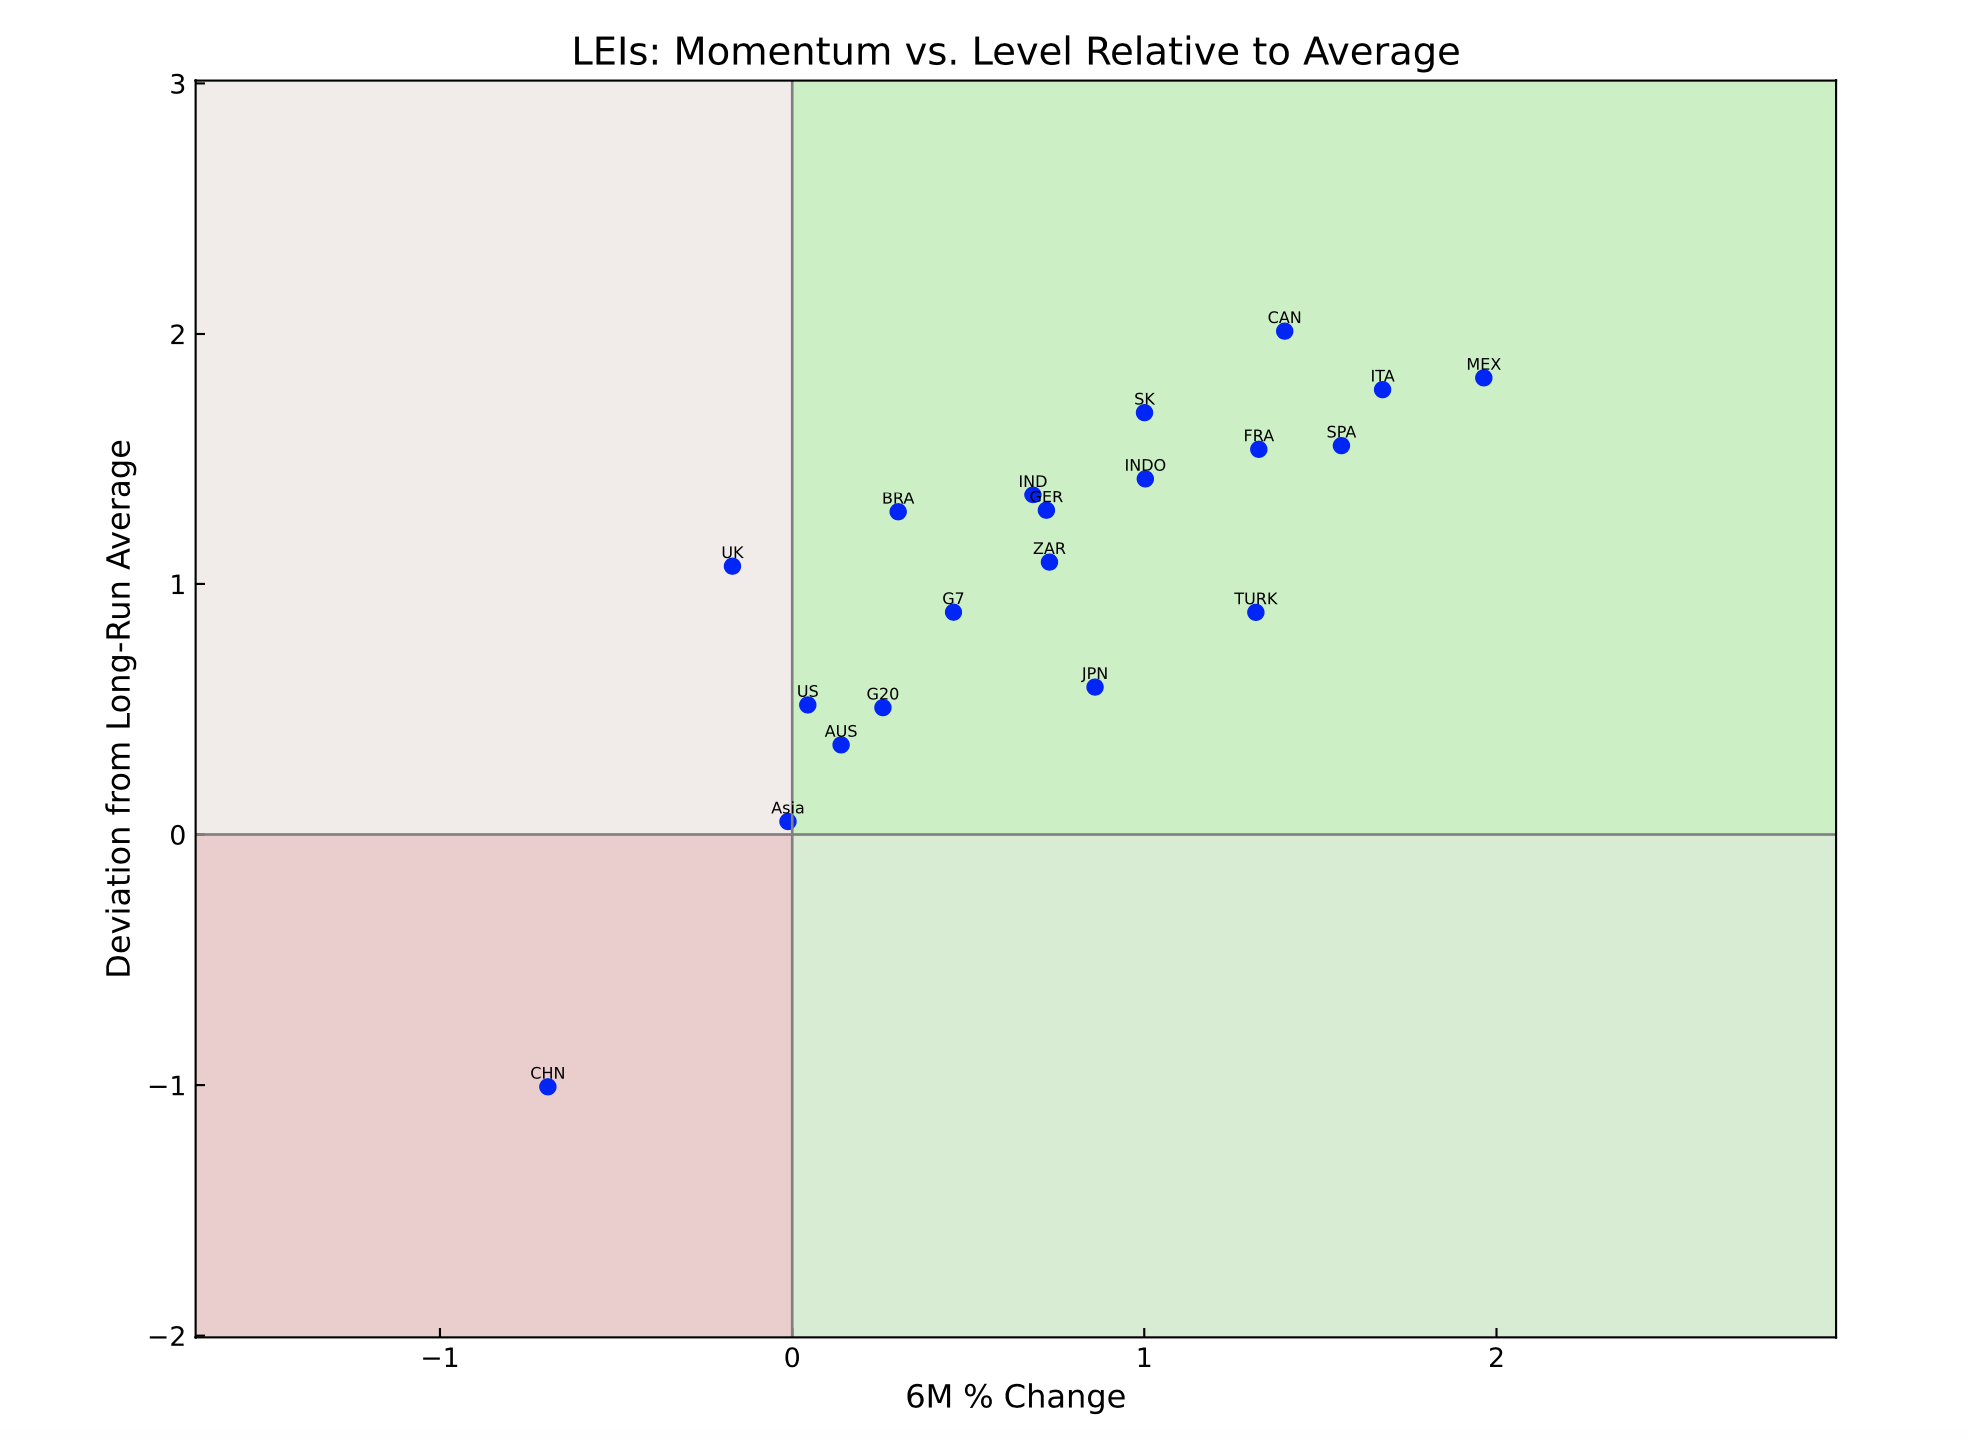
In the meantime, global leading indicators had settled into a broad-based upturn by the end of last year, having rebounded convincingly from the initial tariff shock earlier in the year. The chart below shows that almost all global LEIs were positioned in the top right quadrant at the end of 2025, signaling a positive and accelerating upturn.
Fourteen out of 20 leading indicators were trending upward in December, unchanged from November. Revisions suggest that global LEIs have held at this broadly robust level since September. On my diffusion index—measured from the rebound that began in late 2022—global LEIs now sit at a cyclical high. Overall, the data point to upside risk for global growth in the first half of 2026.
Coincident indicators have settled into a solid expansion, consistent with the upturn in leading indicators. Growth in global industrial production and trade slowed to 3.1% year-over-year in October, from 4.3% in September, but this does not mark the beginning of a downturn. The trend has stabilized in the 3.5%–4.0% range since mid-2025.
The three-year rolling Z-score of the global LEI—often a reliable early signal for turning points in the global cycle—improved further in late Q4, breaking out of the sideways drift seen in early summer. At 1.5, the Z-score remains below previous major cyclical peaks but continues to rise.
Equity markets have continued to post strong returns, despite a slight easing in momentum recently. A flare-up in trade tensions between the U.S. and EU will be a test, but markets will likely be slow to respond, expecting the U.S. president to stop short of imposing high tariffs on a sustained basis. In short, the tussle over Greenland is high-stakes geopolitics, but until the shooting starts—literally—markets will assume it will be resolved through some kind of deal.
The first principal component (PC1) of global LEIs remained in a clear and strengthening downtrend in December. PC1 captures common cyclical patterns across countries and typically peaks during synchronized global downturns. Its current weakness suggests growing divergence among economies, which is generally associated with cyclical strength in the global economy.
Country-level data indicate a broad and robust upturn in global economic activity in late Q4. China—and, as a result, the aggregate Asia LEI—remains the most notable weak spot, with the U.K. LEI also showing signs of rolling over from a peak. LEIs in Canada, Italy, Mexico, France, Spain, and South Korea currently show the strongest positive momentum.