Global Leading Indicators, January 2026 - As good as it gets
The January 2026 edition of the global LEI chartbook can be found here. Additional details on the methodology are available here.
I told you that I have a knack for updating these chartbooks at potential turning points—more specifically, whenever Mr. Trump decides to give his tariff Wheel of Fortune a spin. The ink had barely dried on the US Supreme Court’s decision ruling against the legality of Mr. Trump’s tariffs before the president vowed to impose an additional 10% tariff on top of the existing measures, later raising that figure to 15%. No one—least of all the president himself—knows whether these new tariffs will actually be implemented, or indeed what they would be applied to, given that the original tariffs are now supposedly illegal. It is little wonder that markets initially shrugged off the news on Friday. Then there is Iran, and the prospect of a sustained rise in oil prices. I am not perturbed by either development, though I would not wish to spend the next few days at an Iranian military installation, all the same.
The message from leading indicators is one of a broad-based and strengthening recovery in the global economy at the start of 2026, pointing to at least six months of robust coincident data ahead. With inflation still relatively benign in most key markets—for now—and further monetary easing in the pipeline from both the Fed and the BOE, the near-term outlook could be worse—much worse. Indeed, one could argue that, as far as global leading indicators are concerned, the current synchronised upturn depicted below—with China as the notable laggard—is about as good as it gets.
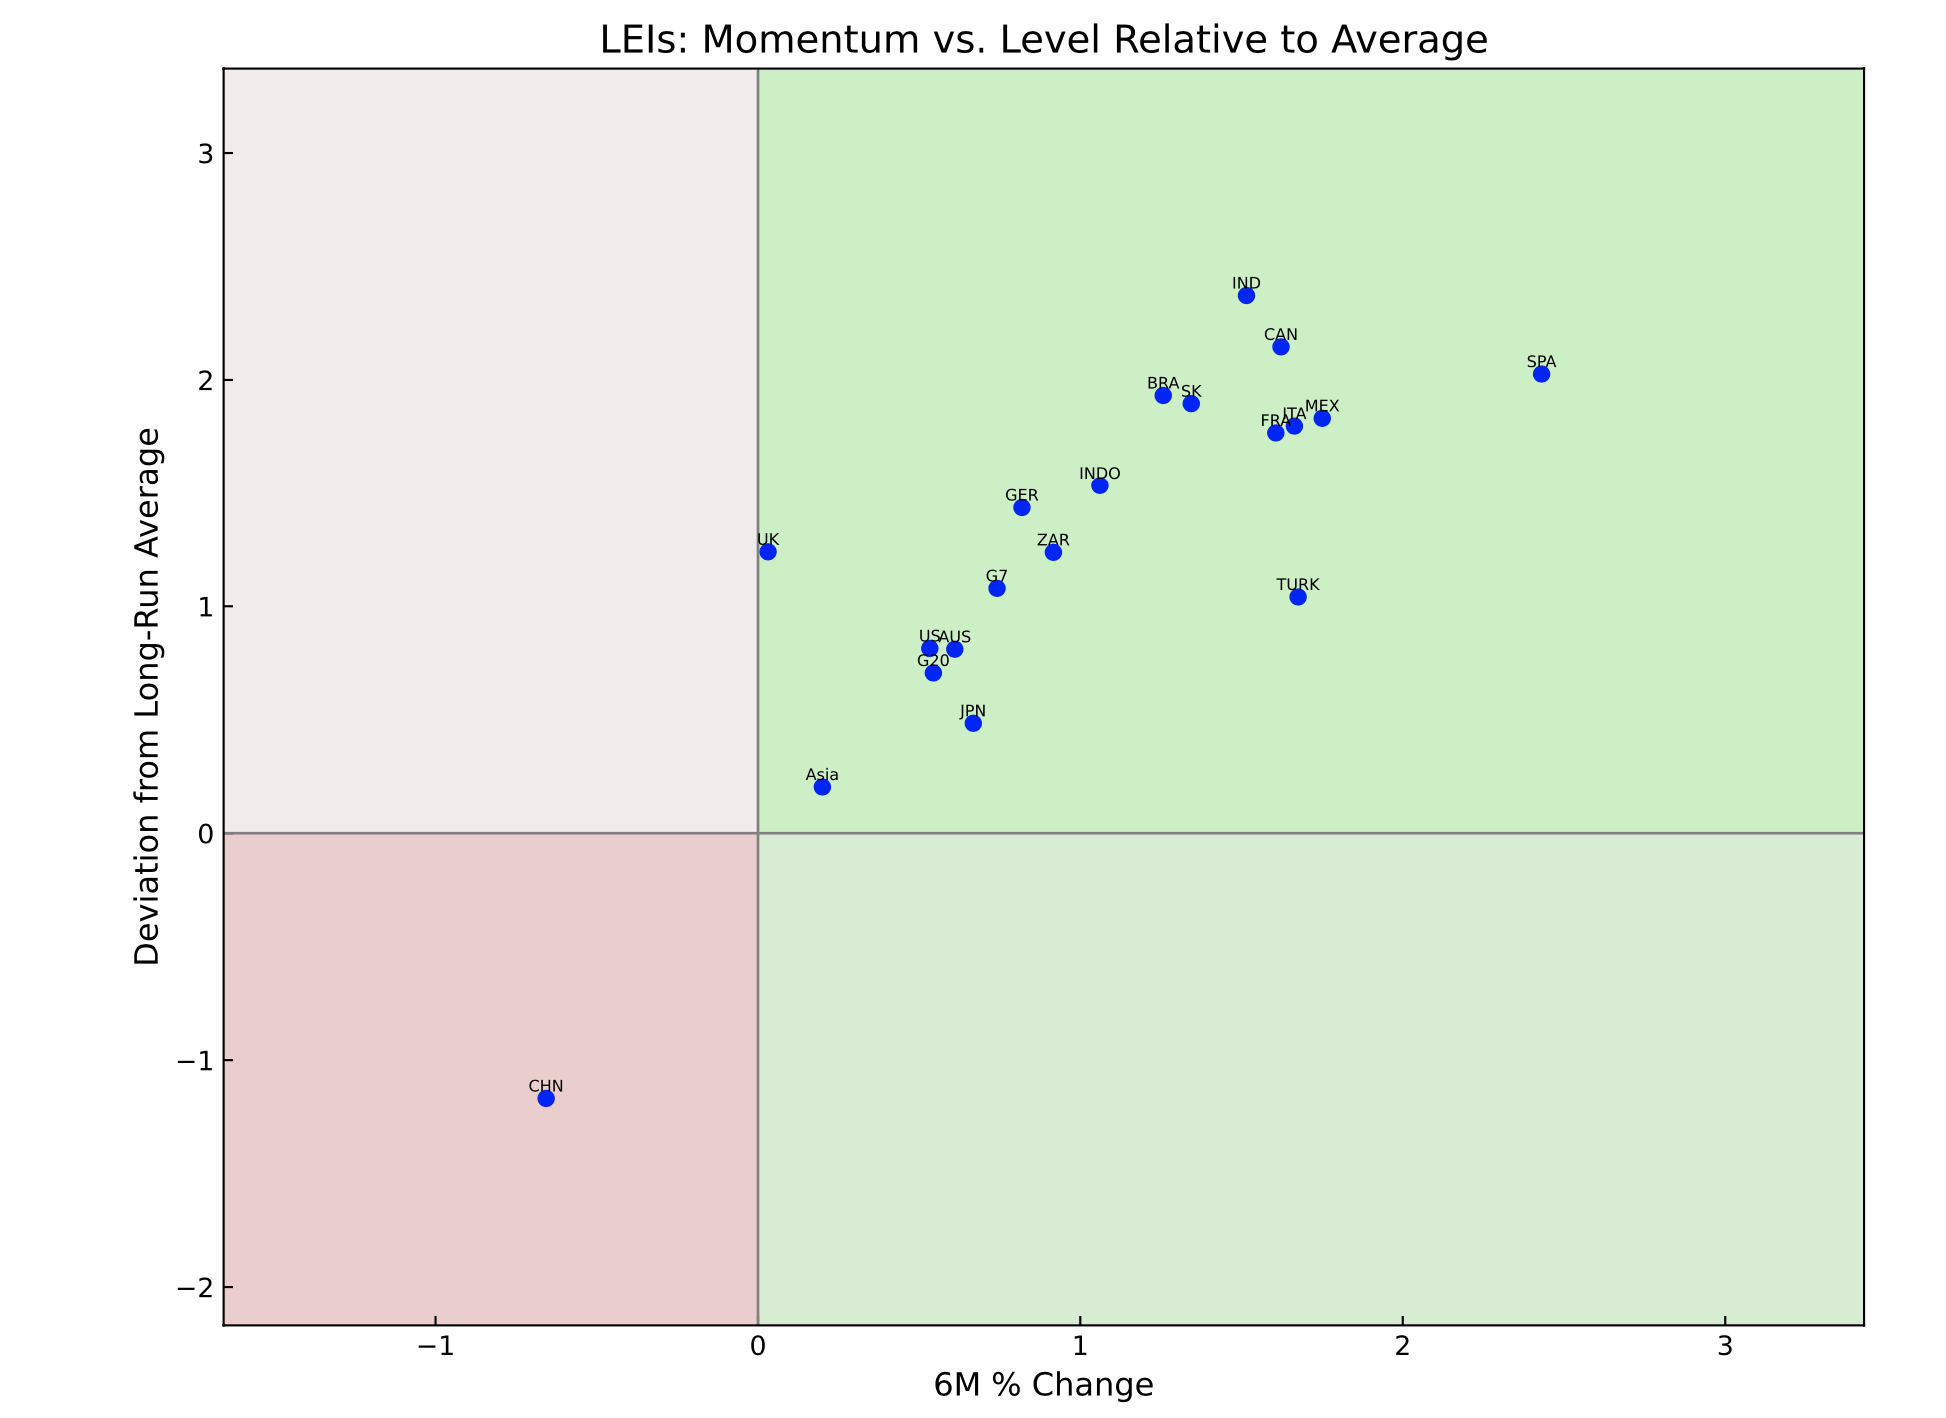
Sixteen out of 20 leading indicators were trending upward in January, unchanged from December and slightly down from 18 in November. Revisions now point to a stronger upturn since Q4 than initially estimated. On my diffusion index—measured from the rebound that began in late 2022—global LEIs are now sitting very close to a cyclical high.
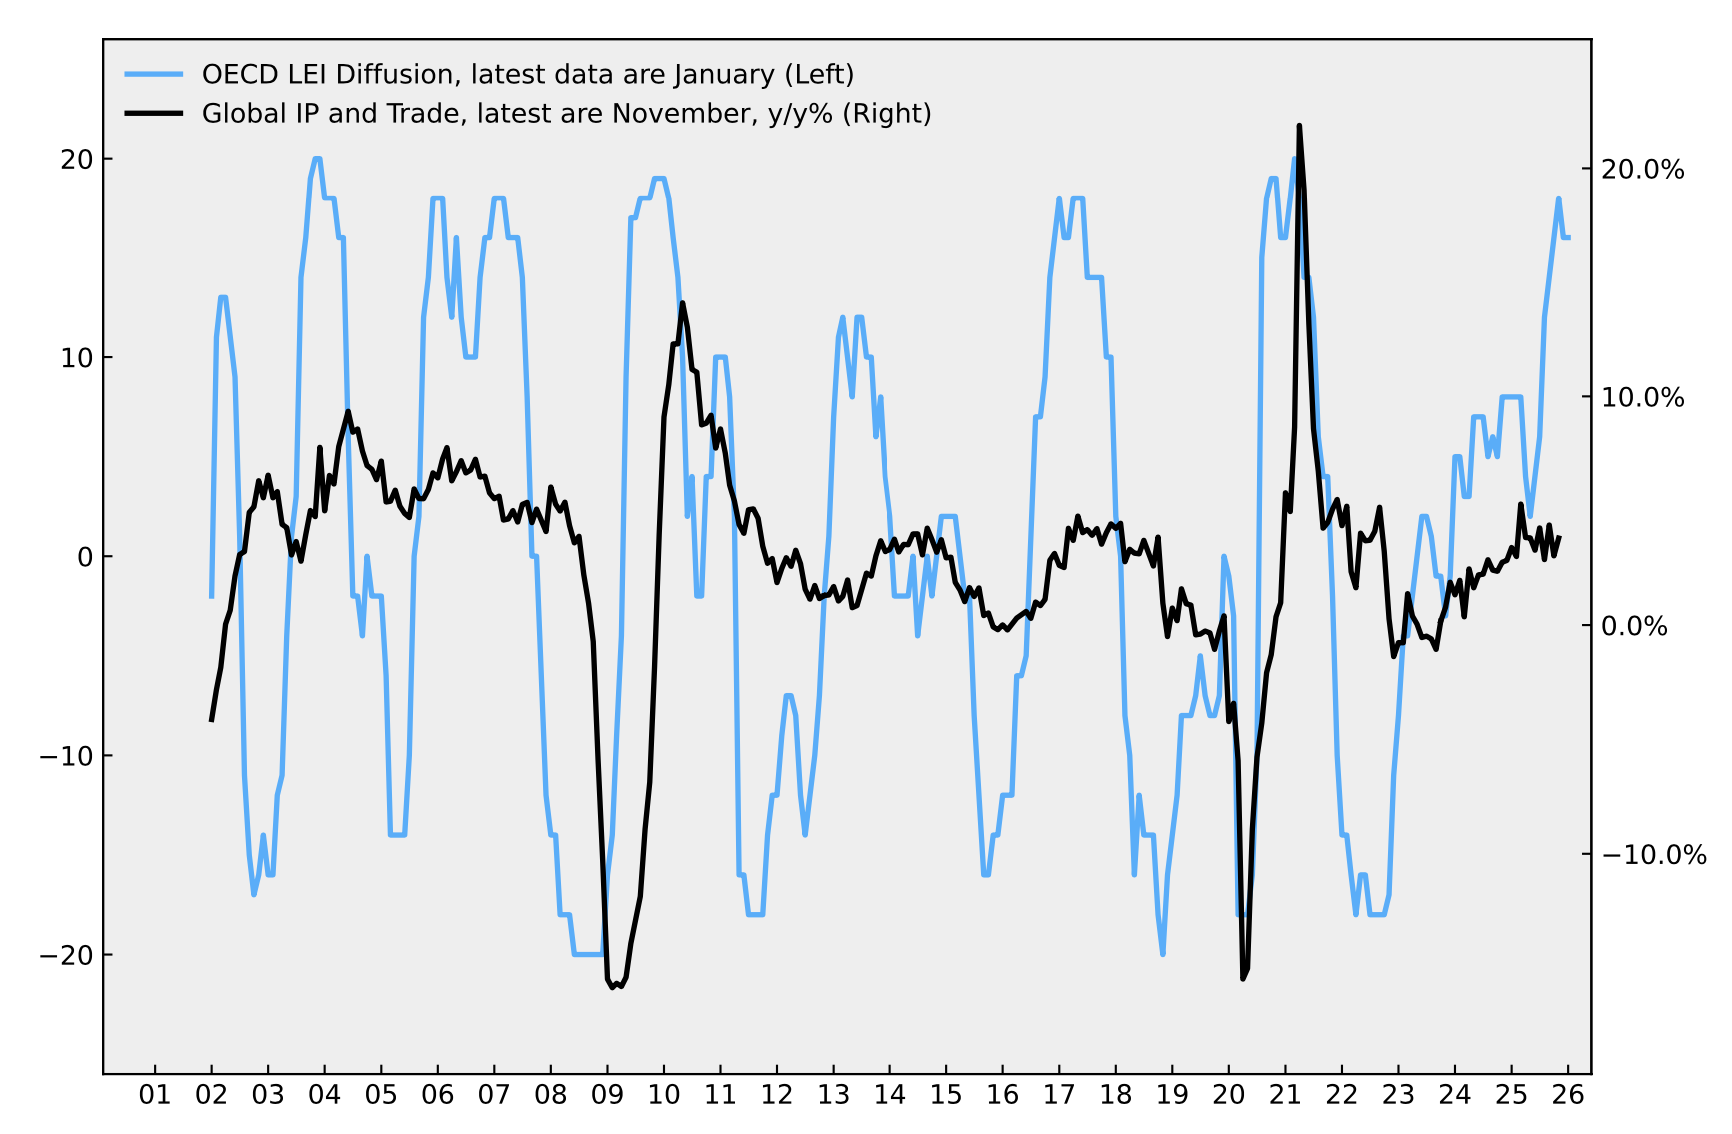
So what happens next? The chart above suggests that growth in coincident indicators typically continues to accelerate for at least six to twelve months after a cyclical high in leading indicators, pointing to robust global cyclical activity through most of 2026. But what about markets? To explore this, I conducted a small study, sampling six-month returns on the S&P 500 ahead of instances where my LEI diffusion index reached 15 or higher and was rising on a six-month basis. This yielded 38 instances in a sample going back to 2003, with an average six-month return of 7.6%. The ratio of positive to negative returns is solid at 32:6. The maximum return was 27%—in the six months starting in October 2020—while the worst was -7% in the six months beginning in 2009. In short, just because global LEIs are at their highs—where they typically do not remain for more than six to nine months—does not mean investors should sell equities in anticipation of a downturn.
Coincident indicators have settled into a solid expansion, consistent with the upturn in leading indicators. Growth in global industrial production and trade accelerated to 3.8% year over year in November, up from 3.0% in October. The strength in LEIs suggests that further acceleration is likely.
The three-year rolling Z-score of the global LEI—often a reliable early signal of turning points in the global cycle—improved further in early 2026, reaching 2.36 in January, within a whisker of its all-time high of 2.66 in January 2007.
Equity market returns have eased somewhat, driven mainly by the sell-off in technology stocks—more specifically SaaS names—but the underlying trend remains strong, particularly in non-US equities. Based on the analysis above, US—and, by extension, global—equities are on track for further positive returns over the next six months.
The first principal component (PC1) of global LEIs remained in a clear and strengthening downtrend in January. PC1 captures common cyclical patterns across countries and typically peaks during synchronized global downturns. Its current weakness suggests growing divergence among economies, which is generally associated with cyclical strength in the global economy.
Country-level data point to a broad and robust upturn in global economic activity in late Q4. China’s LEI remains the only notable weak spot—significant given the size of its economy. The UK’s LEI has moved back into positive and expanding territory after flirting with contraction in previous months.