Equity Sector Rotation Chartbook, February 2026 - The Tangible Economy Strikes Back
The February 2026 edition of the S&P 500 equity sector rotation chartbook can be found here You can read more about the methodology and underlying assets here.
The SaaSpocalypse is upon us and with it comes the inevitable soul-searching among investors who believed that a concentrated bet on US and global tech was a never-losing source of excess returns relative to the broader market. To me, this looks like a long-overdue sell-off in search of a narrative rather than the other way around, but it is a compelling narrative nonetheless.
First, the AI children are threatening to eat their guardians. Investors are increasingly contemplating the prospect that native AI services may become so powerful that they supplant the SaaS complex entirely, rather than merely complementing existing services and products. If the previously uncrossable moats of many market-leading SaaS firms—not to mention legal, financial, and generic business service providers—are now being bridged by AI, then very high multiples and earnings expectations will have to come down, and by a lot.
Second, the drawdown in the equity of high-flying tech and software companies has ignited fears around the boom in lending tied to this story, raising the spectre of a rout in publicly traded—and particularly private—credit.
Third, and specific to the so-called hyperscalers, several household names are now guiding towards capex levels that exceed their free cash flow generation in order to keep the AI train on the tracks. This is problematic if the primary reason for owning these stocks in the first place was their free cash flow generation. In theory, it should not matter whether this investment is financed via debt or equity issuance—I suspect it will be the former—but in practice, the bull case for common equity is challenged in both scenarios, as equity investors weigh either subordination or dilution.
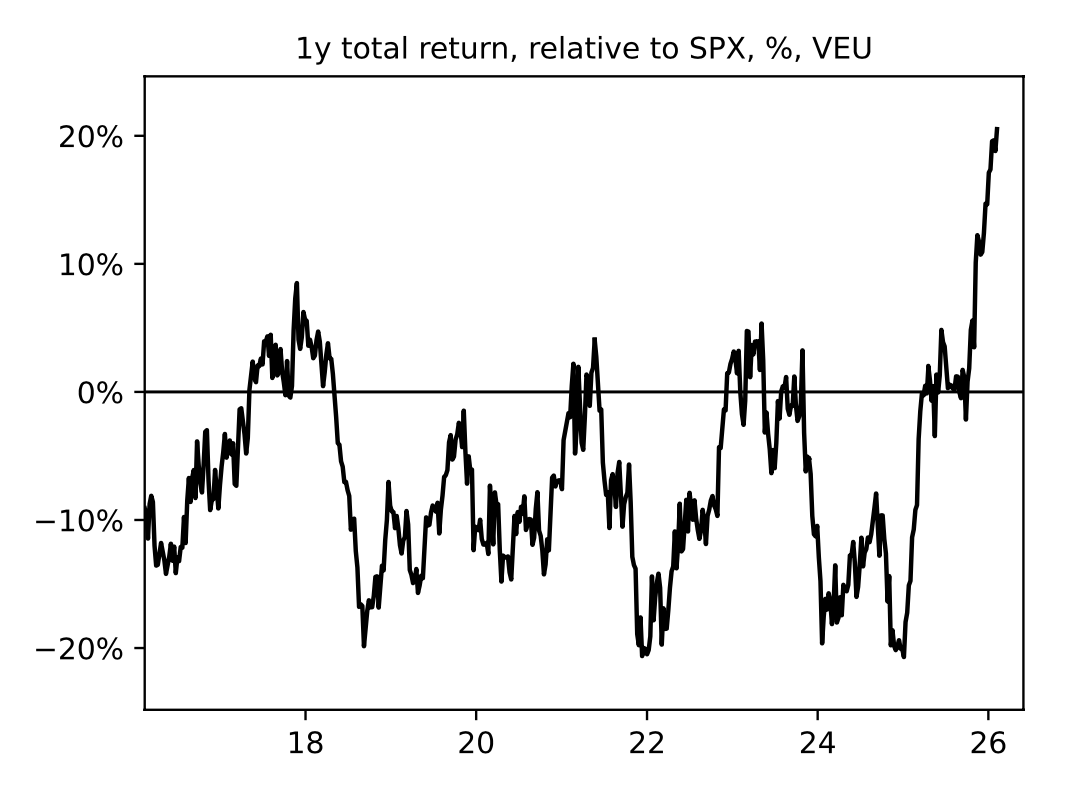
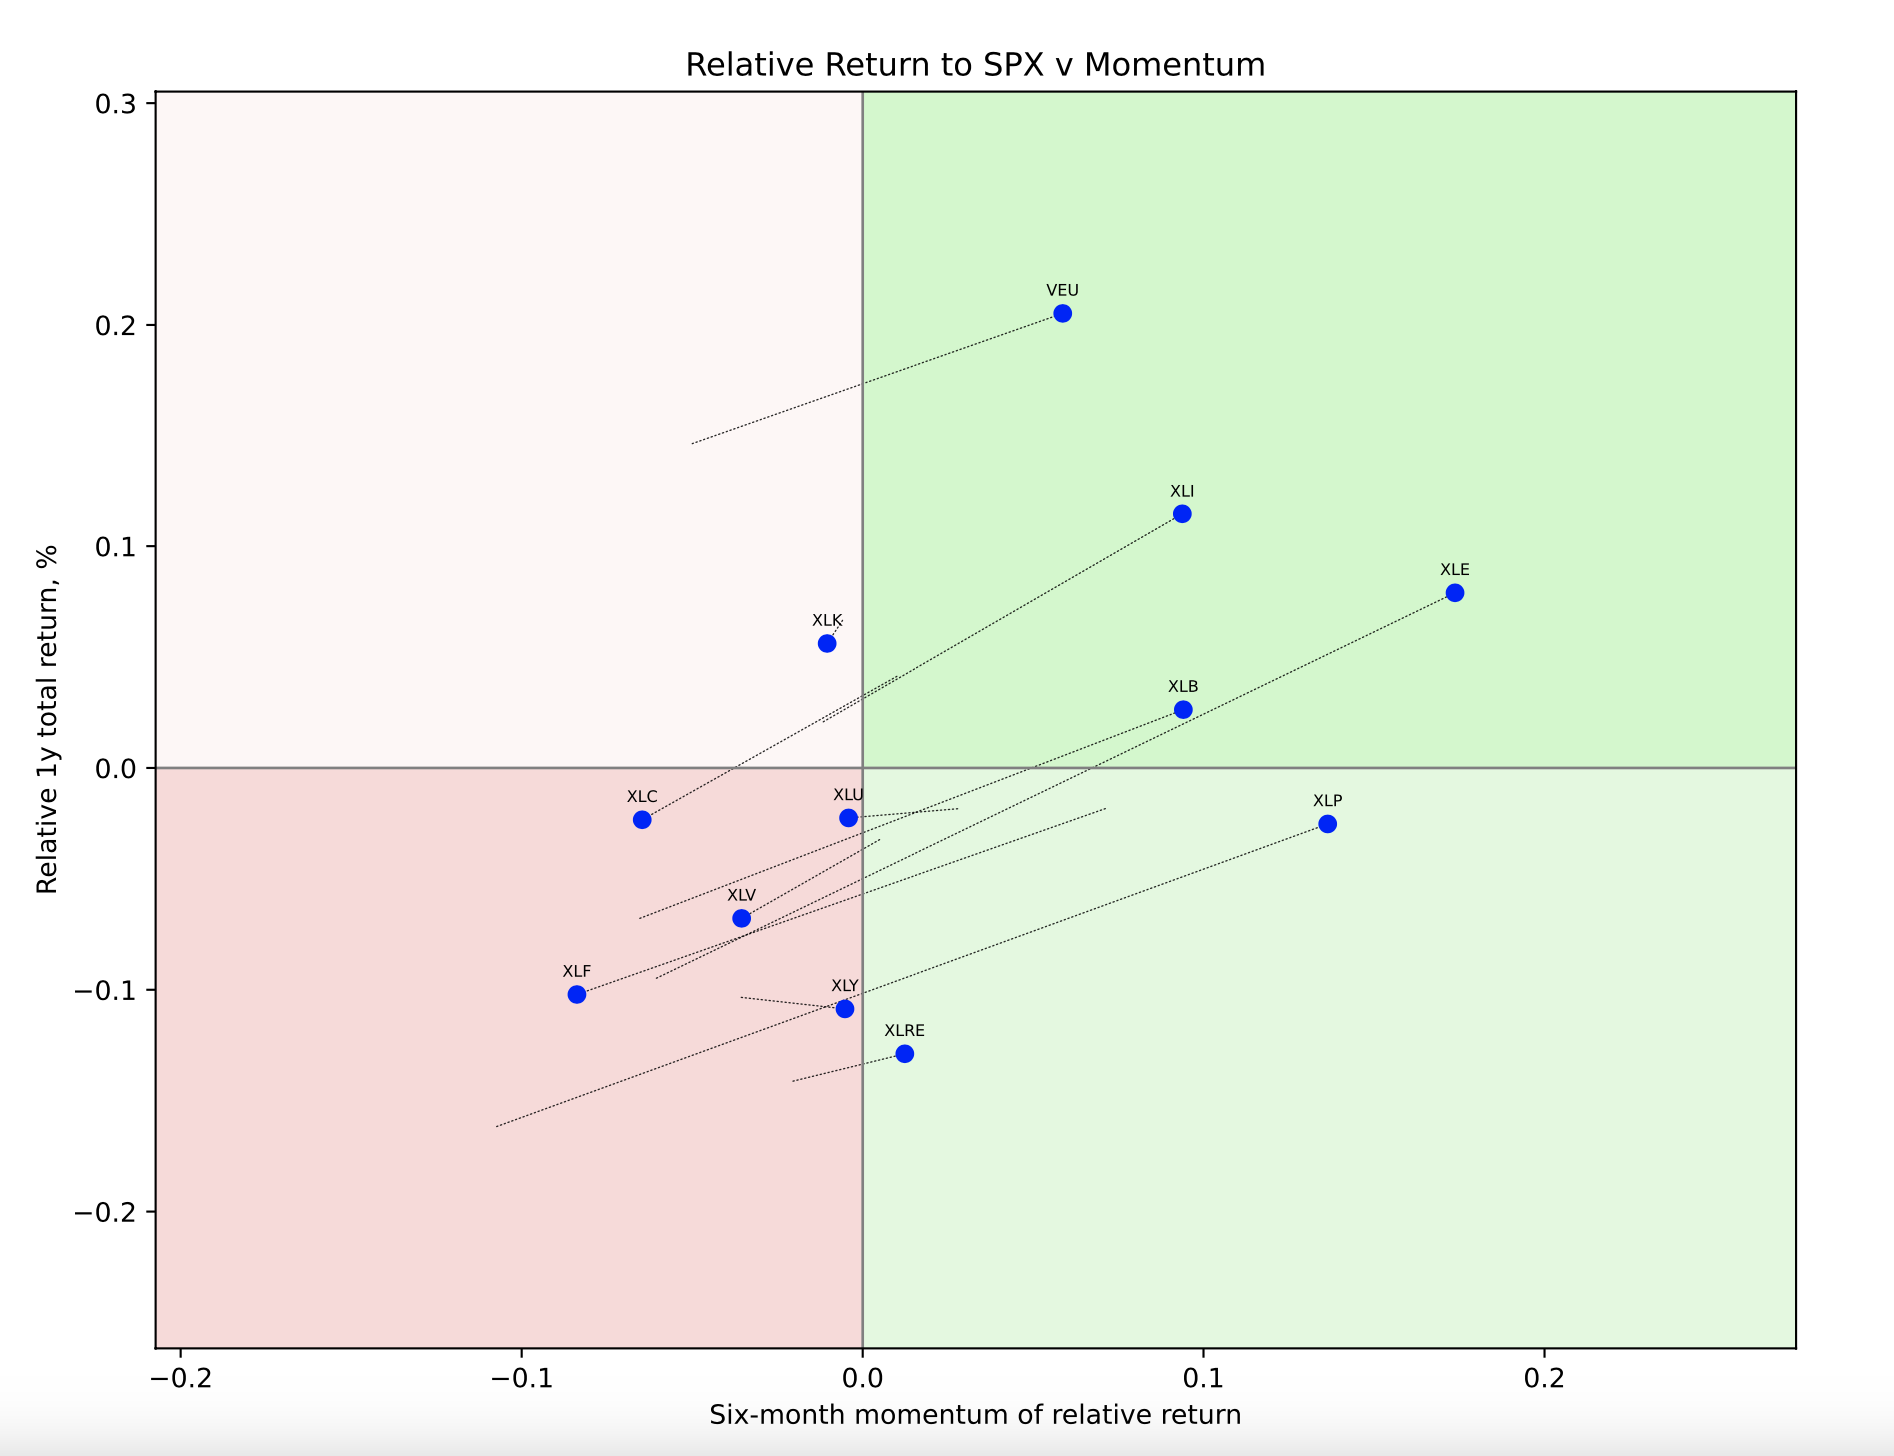
The second chart below shows that equity leadership has shifted markedly since I last updated these charts in October. The real, tangible sectors are now leading the pack, with XLI (Industrials), XLE (Energy), and XLB (Materials) firmly positioned in the top-right quadrant, alongside the powerhouse that remains non-US equities. The relative outperformance of VEU has reached new highs, as the next chart illustrates.
The rise of the “tangible sectors” has come at the expense of accelerating underperformance in XLK (Technology), XLC (Communication Services), and XLF (Financials).
Among the traditional defensive sectors, XLV (Healthcare) and XLU (Utilities) are churning, with no clear path toward a move into the top-right quadrant. By contrast, XLP (Consumer Staples) is beginning to look like a genuine rising star, leaving its more cyclical sibling, XLY (Consumer Discretionary), in the dirt. XLRE (Real Estate) also deserves a notable mention for making a run at rising-star status, though history suggests it is unlikely to succeed. That said, if one were inclined to bet on a bullish Warsh–Bessent pincer movement—using the Fed and Treasury to compress mortgage rates and perhaps long-term borrowing costs more broadly—this would be the sector to express that view in equities.
More generally, the trailing relative performance of XLK and XLC remains well above previous troughs, suggesting that the sell-off in these sectors—at least in relative terms—could easily run further still.
Stuff is back in vogue