Global Leading Indicators, February 2026 - Upturn confirmed; will it slip in rising oil prices?
The February 2026 edition of the global LEI chartbook can be found here. Additional details on the methodology are available here.
The February update of the global LEI chartbook confirms that a broad-based upturn in global cyclical activity has been underway since the end of the third quarter last year. Granted, the number of LEIs currently in expansion—16—is slightly lower than at previous cyclical peaks. However, the February update and revisions point to a stabilising expansion at this rate, which remains robust overall.
The big question now is whether the upturn will falter in the face of the energy price shock ignited by the war in Iran.
Time will tell.
In many ways, the war in Iran—and how investors interpret it in relation to Mr. Trump’s motives and expectations of an endgame, or lack thereof—is symptomatic of how markets think about geopolitical risk in an era of volatile US foreign policy. Let’s give the devil his due. Almost everyone agrees that Iran cannot be allowed to develop nuclear weapons, and few people will shed many tears over the demise of Ayatollah Khamenei, let alone the regime that has sustained him. Mr. Trump, aided and abetted by Israel, has seized what he views as a unique opportunity to deliver a decisive blow to a belligerent Iranian regime that has long sown instability in an already volatile region. In this sense, Mr. Trump is sticking to his opportunistic reaction function—picking what he sees as low-hanging fruit.
So far, so good. The Iranian military cannot lay a glove on either US or Israeli forces, which now appears to be emboldening the White House to make an example of the country, I suspect for a reason that has yet to be fully recognised by many observers.
Mr. Trump may genuinely believe that a show of force in Iran plays well with the domestic MAGA crowd, whose hearts glow with every Tomahawk missile that finds its target. Many commentators will rightly point to the significant risk he is taking. After all, he was elected on a platform of putting America first, defined at least in part as avoiding new wars in the Middle East without a clear objective or endgame. Yet Mr. Trump is now betting that images of the US military striking Iran will resonate with swing voters in the upcoming midterm elections. Moreover, the easier it appears for the US to pound Iran militarily—and at the moment it does look relatively easy—the lower the perceived risk that his political base will punish him for becoming entangled in a prolonged conflict.
Secondly, and more cynically, Mr. Trump may be attempting—like Roman emperors of old—to stage a gladiatorial spectacle in the Colosseum, diverting the attention of the plebs from rising bread prices or, in this case, perhaps from some unflattering revelations in the Epstein files.
The president is, as usual, engaged in a high-stakes game. Whatever the White House may believe about the MAGA-boosting credentials of a military show of force, the contradiction between the pledge to avoid “forever wars” in the Middle East and the possibility of entering one is difficult to ignore. This conflict could usher in an era of relative peace and stability in the Middle East—or the Iranian republic and its civil society could implode, with destabilising consequences for the broader region. It is not clear that the White House is overly concerned either way.
Then there is the surge in oil and gas prices, threatening a new inflation shock, higher interest rates, and tighter financial conditions. As impressive as it may be to watch footage of a US submarine sinking a hapless Iranian warship, it does little to help US consumers and businesses who may now be staring down the barrel of a good old-fashioned energy shock at a time when inflation is already elevated.
As I write this on Sunday, March 8, markets will primarily be watching for signs that a trifecta of rising energy prices, rising bond yields, and falling stock prices might eventually prompt Mr. Trump to back down. For now, signals from the White House remain hawkish, suggesting that markets may need to inflict more pain before forcing a so-called “TACO.” This, in turn, threatens a prolonged rise in energy prices and sustained market volatility that could spill over into real economic activity.
The unique challenge for the global economy at this juncture is that underlying inflation remains elevated following the post-COVID shock and the war in Ukraine. Soft landings—defined as the ability to raise interest rates enough to bring down inflation without triggering a recession—leave the economy vulnerable to renewed inflation shocks. Should that occur, central banks could once again be compelled by incoming data to tighten monetary policy in order to deliver a decisive blow to inflation, which many policymakers—perhaps influenced by recency bias—may feel was never fully defeated in the first place.
Such a scenario would risk ushering in a more traditional tightening cycle, in which the price of restoring price stability is a recession and a significant rise in unemployment.
Sixteen out of 20 leading indicators were trending upward in February, unchanged from September last year after revisions, which point to a sustained upturn in global economic activity since the of the third quarter.
[Reproduced from the January update] So what happens next? The chart above suggests that growth in coincident indicators typically continues to accelerate for at least six to twelve months after a cyclical high in leading indicators, pointing to robust global cyclical activity through most of 2026. But what about markets? To explore this, I conducted a small study, sampling six-month returns on the S&P 500 ahead of instances where my LEI diffusion index reached 15 or higher and was rising on a six-month basis. This yielded 38 instances in a sample going back to 2003, with an average six-month return of 7.6%. The ratio of positive to negative returns is solid at 32:6. The maximum return was 27%—in the six months starting in October 2020—while the worst was -7% in the six months beginning in 2009. In short, just because global LEIs are at their highs—where they typically do not remain for more than six to nine months—does not mean investors should sell equities in anticipation of a downturn.
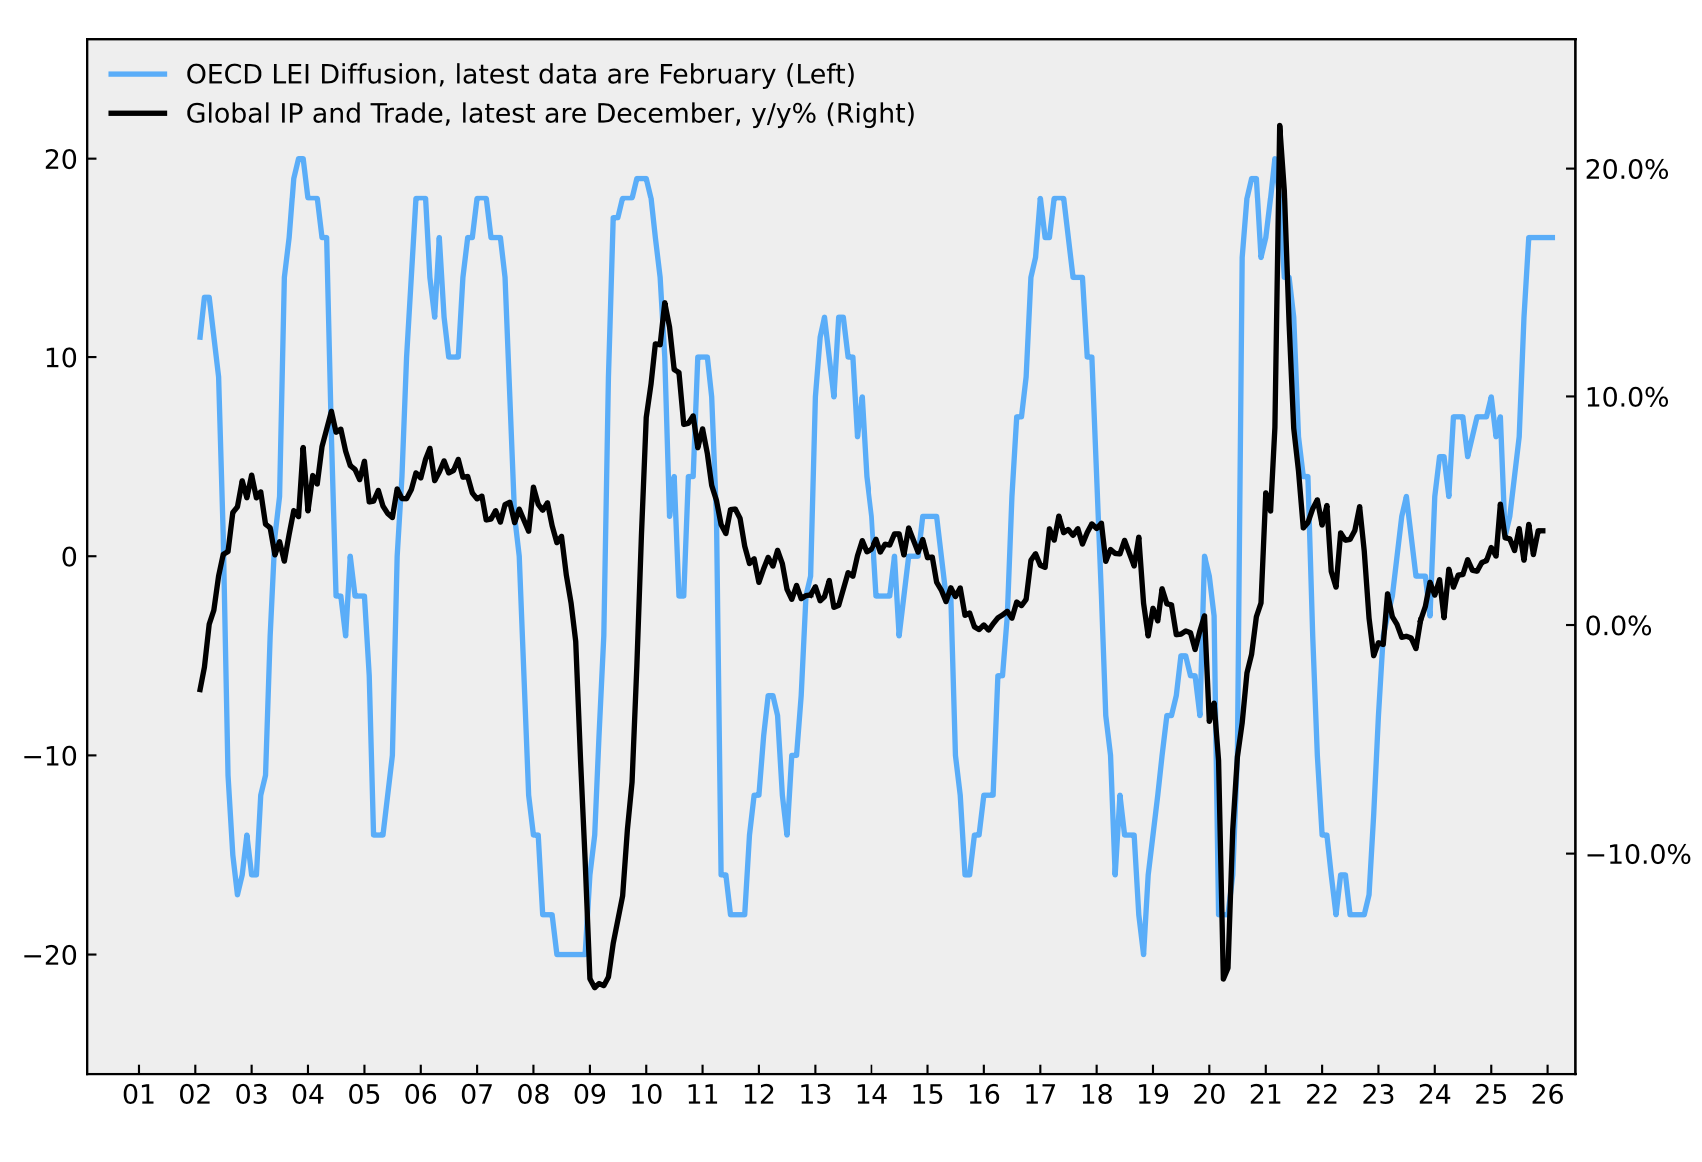
Coincident indicators have settled into a solid expansion, consistent with the upturn in leading indicators. Growth in global industrial production and trade accelerated to 4.1% year over year in December, unchanged from an upwardly-revised November headline. The strength in LEIs suggests that further acceleration is likely.
The three-year rolling Z-score of the global LEI—often a reliable early signal of turning points in the global cycle—is still rising, reaching 2.69 in January, an all time high in this sample,.
Equity market returns rebounded somewhat in February, rebounding from weakness at the start of the year, but now face stiff headwinds as global energy prices soar and volatility rises. Energy stocks and defensives are set to outperform as long as our eyes are peeled in Iran, but the trajectory of leading indicators suggest that underlying sector rotation models should continue to favour cyclical sectors more generally,
The first principal component (PC1) of global LEIs remained in a clear and strengthening downtrend in February. PC1 captures common cyclical patterns across countries and typically peaks during synchronized global downturns. Its current weakness suggests growing divergence among economies, which is generally associated with cyclical strength in the global economy.
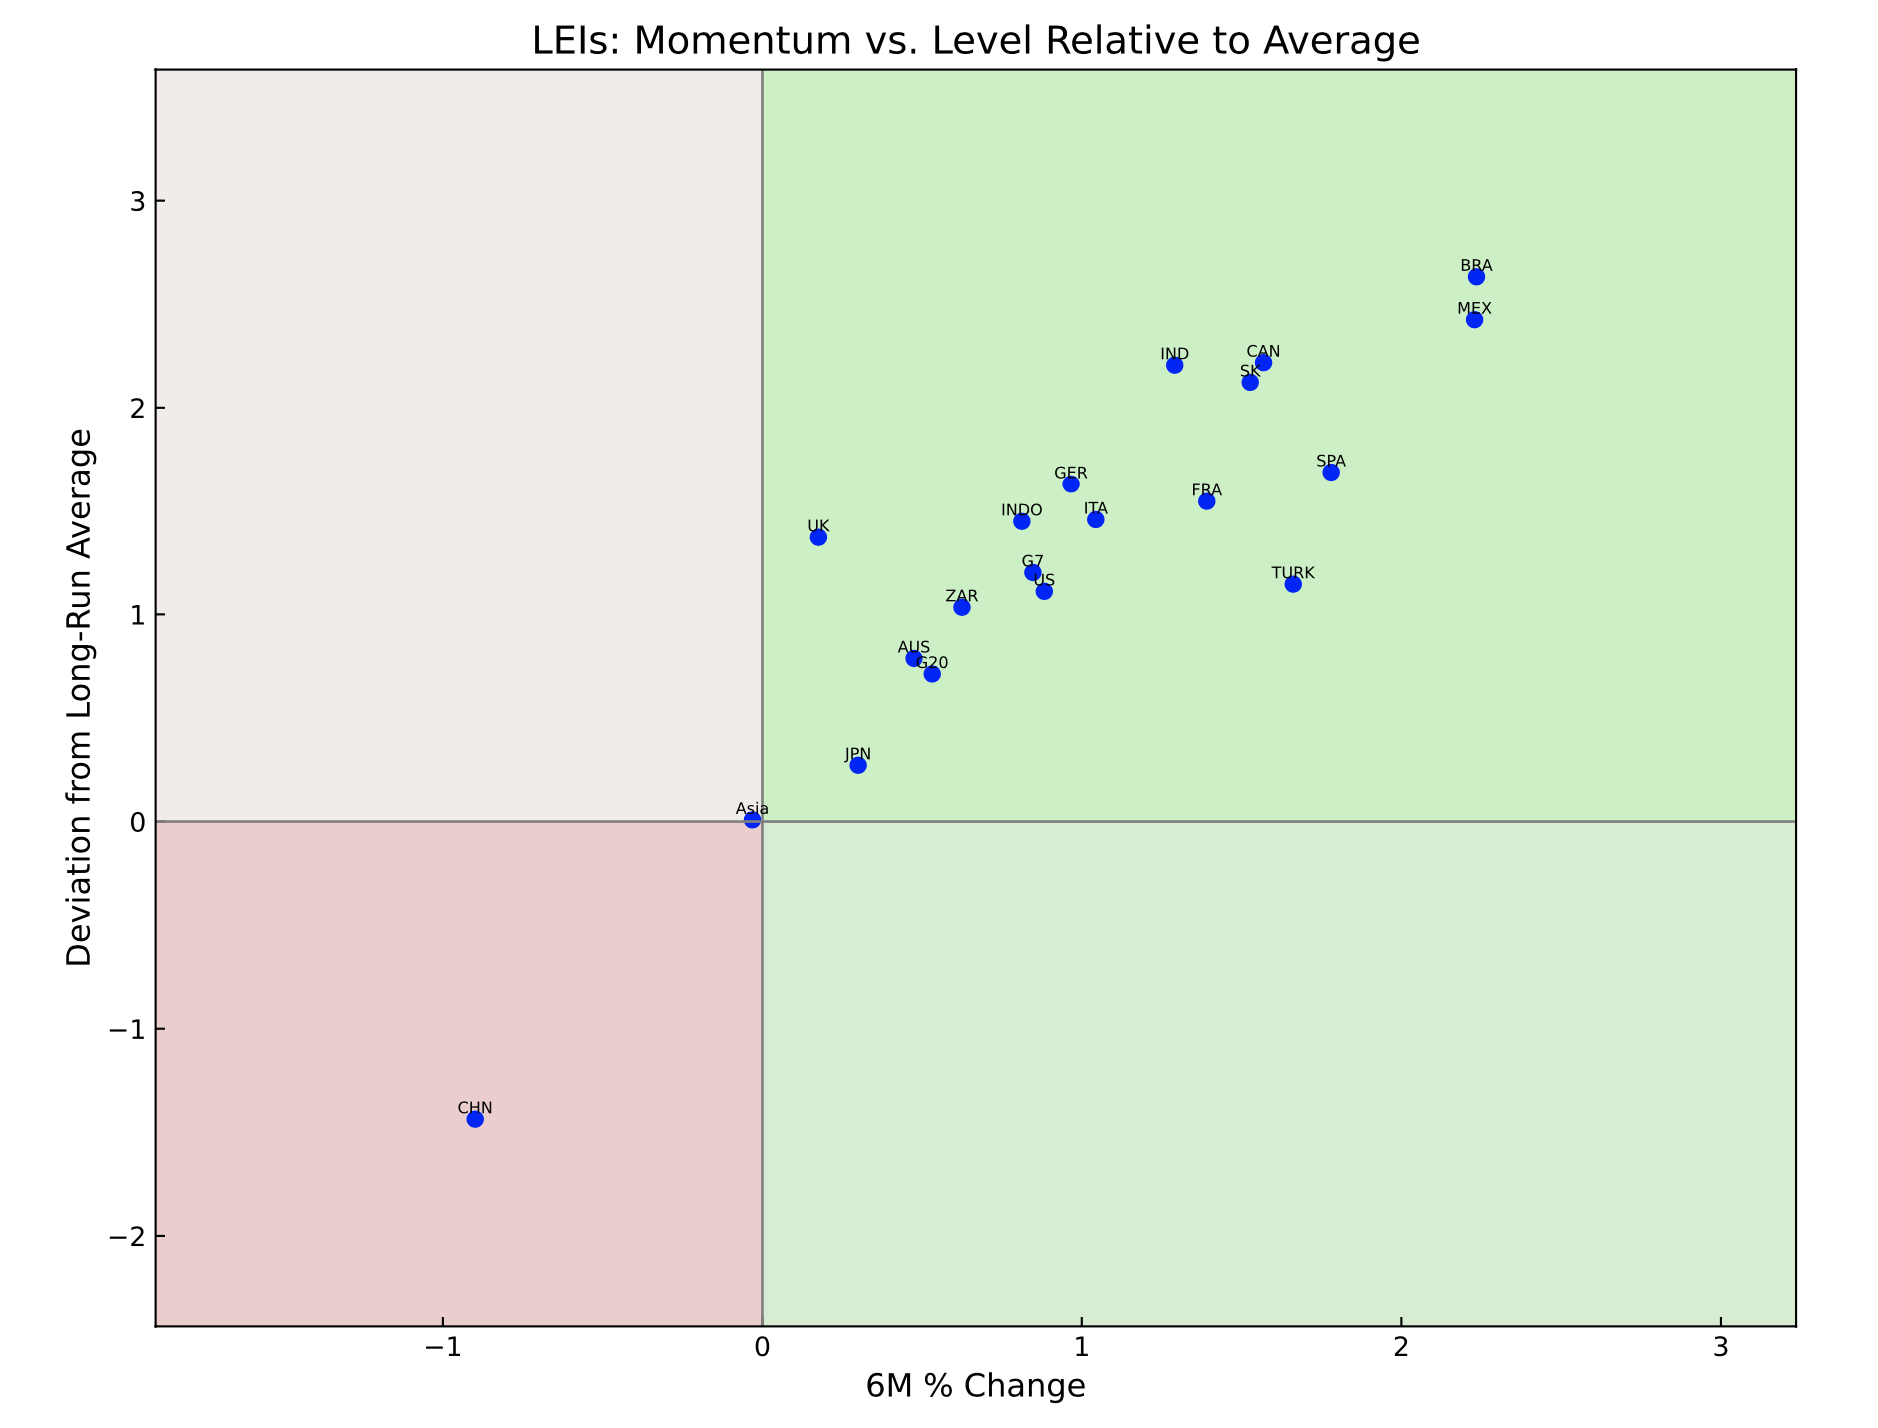
Country-level data point to a broad and robust upturn in global economic activity midway through the first quarter of 2026. China’s LEI remains the only notable weak spot—significant given the size of its economy, which is also weighing on the LEI in Asia.