Global Leading Indicators, March 2026 - A Chink in the Armour
The March 2026 edition of the global LEI chartbook can be found here. Additional details on the methodology are available here.
The March update of the global LEI chartbook confirms that a broad-based upturn in global cyclical activity has been underway since the end of the third quarter of last year. However, the data show hints of weakness at the end of Q1, with the number of positive LEIs sitting at 14 out of 20—unchanged from a downwardly revised level in February and below the average of 16 recorded between September and January. This deterioration comes before leading indicators have had to contend with the chaos wrought by the war in Iran and disruptions to energy and commodity flows through the Strait of Hormuz and, more broadly, across the Middle East.
The good news, as far as Mr. Trump’s adventurism goes, is that history suggests leading indicators tend to rebound quickly once the US president attempts to extract himself from the turmoil of his own making. The main problem, however, is that—unlike in the case of the Liberation Day tariffs—the US president is now in a situation where he cannot unilaterally de-escalate. Iran has found a unique bargaining chip in its control over economic flows through the Strait of Hormuz, one that Tehran is unlikely to relinquish anytime soon, regardless of how overtly Mr. Trump rolls over in the face of the much-debated ten-point plan or other concessions.
This is now generating a potentially fatal challenge for the global economic cycle. Underlying inflation remains elevated in many regions following the post-COVID shock and the energy and supply disruptions triggered by the war in Ukraine. While central banks have generally eased as the inflation shock has abated—effectively withdrawing restrictive policy in line with a return to more moderate underlying inflation—upside risks remain latent. This is a trade-off the global economy, policymakers, and investors have not faced since the period following the policy response to the 9/11 terrorist attacks and the bursting of the Dot-com bubble.
Soft landings—defined as raising interest rates sufficiently to reduce inflation without triggering a recession—are inherently preferable to the more traditional cycle-killing tightening required to restore macroeconomic equilibrium, which typically comes at significant cost to the labour market. However, such soft landings also leave economies vulnerable to renewed inflationary pressures, particularly in the context of exogenous supply-side shocks such as the one currently filtering through from the war in Iran. If inflation were to re-accelerate from still-elevated underlying levels, central banks could again find themselves compelled by incoming data to tighten policy in order to deliver a more decisive blow to inflation.
Many policymakers—perhaps influenced by recency bias and the persistence of inflation over the past few years—might, in fact, respond earlier and more forcefully to avoid repeating the mistake of perceiving inflation as “transitory,” which delayed the response to the post-COVID inflation shock.
The US Federal Reserve, admittedly, is an important outlier among global central banks. While several major central banks are cautiously moving toward tightening—or at least refraining from further easing—markets continue to expect the FOMC to lower rates as the US labour market gradually deteriorates. Still, it is not clear that this represents a positive signal for markets. If the Fed cuts despite rising inflation, it would likely imply a very weak labour market, which would go hand-in-hand with slowing US economic growth, weaker corporate earnings, and poor returns for risk assets.
Conversely, if the Fed eases into a lukewarm labour market, it raises the risk that policymakers drop the ball on inflation. Should inflation re-emerge under these conditions, central banks—including the Fed—may be forced to reverse course and tighten again. This would risk ushering in a more traditional tightening cycle, in which restoring price stability comes at the cost of recession and a meaningful rise in unemployment.
Fourteen out of 20 leading indicators were trending upward in March, unchanged from February. However, February’s reading was subject to a slight downward revision in last month’s update, implying that momentum has eased somewhat from the peak of 16 out of 20 LEIs turning up earlier in the year. This still signals robust underlying momentum, though investors should be mindful that a turn in the second derivative from a peak is a necessary—though not sufficient—condition for a more sustained deceleration in global activity, typically with a lead of six to nine months.
In a previous write-up, I showed that equities tend to deliver strong returns in the three-to-six-month period after leading indicators reach a cyclical peak, cautioning against attempts to pre-emptively pick a market top simply because leading indicators have reached a local high. However, once LEIs begin to dip from a peak, the situation changes somewhat. I ran a small study using data going back to 2006, focusing on instances similar to the current environment where LEIs were declining from elevated levels. This yielded a sample of 14 observations, with an average six-month forward return for the IWRD of 2.8%, compared with a ten-year average of roughly 5–6%. Moreover, in six of the 14 instances, returns were negative over the subsequent six months, with a min-max range of −4.8% to +14.4%. In other words, the return profile remains positively skewed, but negative forward returns now fall well within a “reasonable” distribution range—assuming, of course, that the current dip in LEI proves genuine. We will need a few more months of data to confirm whether the Q1 dip actually materialized. As for Mr. Trump’s adventurism, history suggests that LEIs can recover quickly from any damage if the US president is ultimately able to extract himself in a way that restores the status quo.
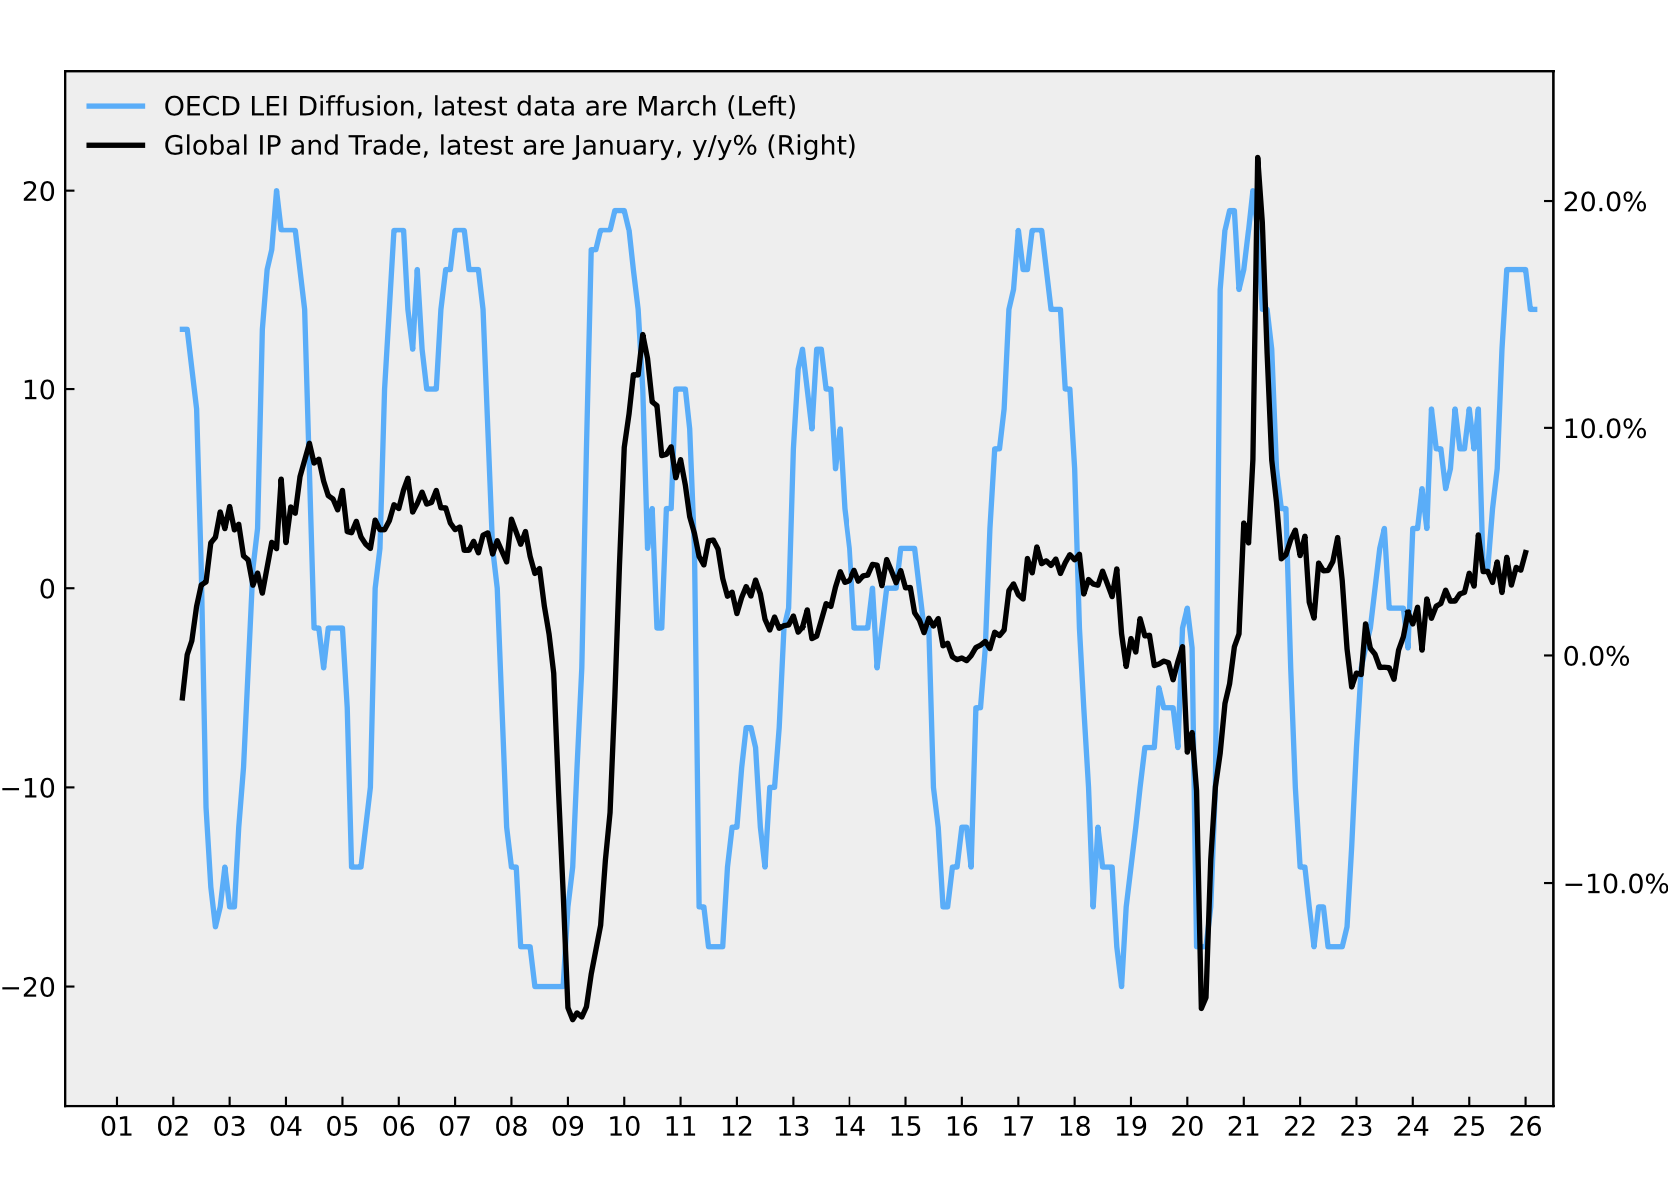
Coincident indicators have settled into a solid expansion, consistent with the upturn in leading indicators. Growth in global industrial production and trade accelerated to an 11-month high of 4.5% year over year in January, with LEIs signalling further near-term acceleration through Q1, before the oil price shock now looms as a downside risk for Q2 and beyond.
The three-year rolling Z-score of the global LEI—often a reliable early signal of turning points in the global cycle—continues to rise, reaching 2.51 in March, just shy of the late-2007 peak of just under 2.7.
Equity market returns faded in March, and geopolitical uncertainty surged in early April following the outbreak of war in Iran and the closure of the Strait of Hormuz. That said, equities have remained broadly resilient, with significant sectoral churn creating opportunities for active investors.
The first principal component (PC1) of global LEIs remained in a clear and strengthening downtrend in March. PC1 captures common cyclical patterns across countries and typically peaks during synchronized global downturns. Its current weakness therefore suggests growing divergence among economies, which is generally associated with cyclical strength in the global economy.
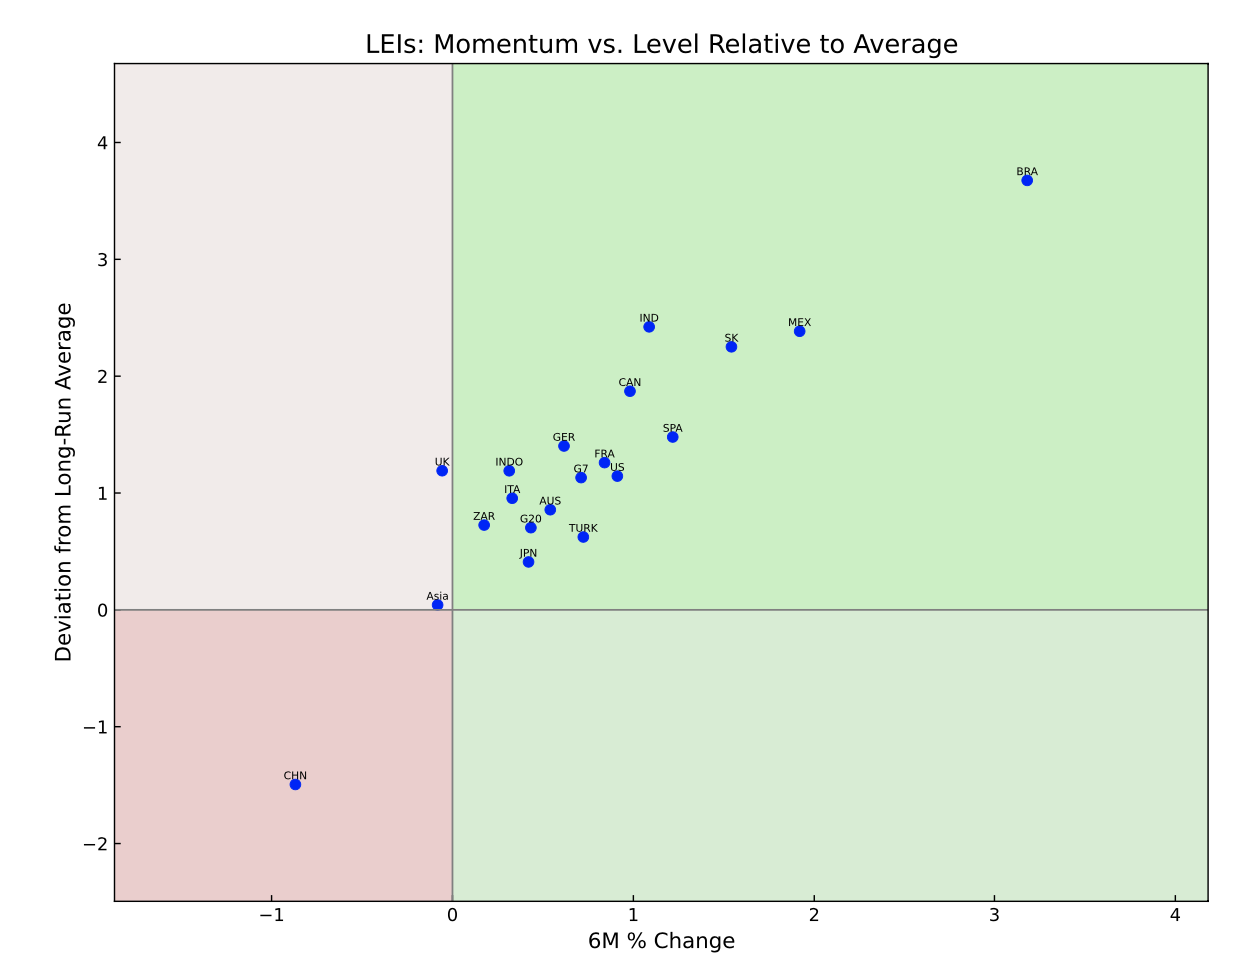
Country-level data continue to point to a broad and robust upturn in global economic activity at the end of the first quarter of 2026. China’s LEI—and, by extension, the Asia LEI—remains the only notable weak spot, significant given the size of China’s economy. The UK LEI also appears to be rolling over, although more data are needed for confirmation. On the positive side, LEIs in Brazil, Mexico, South Korea, and India are currently showing the strongest momentum, pointing to continued strength in emerging markets ex-China.