Equity Chartbooks, June 2026 - How to escape the AI singularity?
I have augmented my US equity sector chartbook with two more similar chartbooks; a simple one with the four major factors—value, momentum and minimum volatility—and one with global country equity indices ex-the US. The factor chartbook uses the iShares global factor ETFs—IWVL, IWMO, MVOL—and VEU for a non-US factor. The global chartbook also uses iShares country ETFs. I have also corrected some errors in the cross-calculation statistics and the corresponding Z-scores.
The latest versions of the chartbooks can be found here (US sectors), here (global beta ex-US) and here (Factors), with there accompanying portfolio statistics here here and here.
These chartbooks cover a lot of ground and contain a great deal of data, so rather than providing a blow-by-blow overview of the numbers, I will focus on extracting the main themes.
Let's start with the obvious. To the extent that the relative rotation charts below are used as momentum frameworks—that is, if you want to be long everything in the upper-right quadrant at the expense of the lower-left—the signal is now very clear: investors should stay long the AI/technology story and forget almost everything else.
That message is somewhat nuanced if we look at the risk-parity portfolios created as part of my chartbook scripts. For the S&P 500—including VEU (World ex-US)—a top-five momentum/risk-parity portfolio, based on data from the past 24 months, currently holds Industrials, Technology, Healthcare, Energy and VEU. For global equities, the equivalent portfolio consists of Taiwan, South Korea, Peru, Thailand and Spain.
But what is the counterpoint?
Merryn Somerset Webb recently argued that "all passive investing is a concentrated momentum play. Is that what you want?", referring to an Apollo chart showing that virtually the entire increase in the S&P 500's market capitalisation has been driven by technology/AI and energy. In reality, unless we zoom in, the story is almost entirely about AI and technology.
Anyone who believes that a position in global equity beta represents a reasonably well-diversified allocation must now contend with the reality that it is anything but. This is true not only for the S&P 500, where XLK (Technology) has become the only game in town, but increasingly for global equities ex-US, where Taiwan's TSMC and South Korea's Samsung and SK Hynix are driving benchmark performance. Meanwhile, in a simple four-factor framework, the gap between the minimum-volatility factor and both momentum and value is now extreme. It is hardly news that buying global equity beta amounts to a concentrated bet on a handful of themes and sectors, but by several measures that concentration has reached exceptional levels.
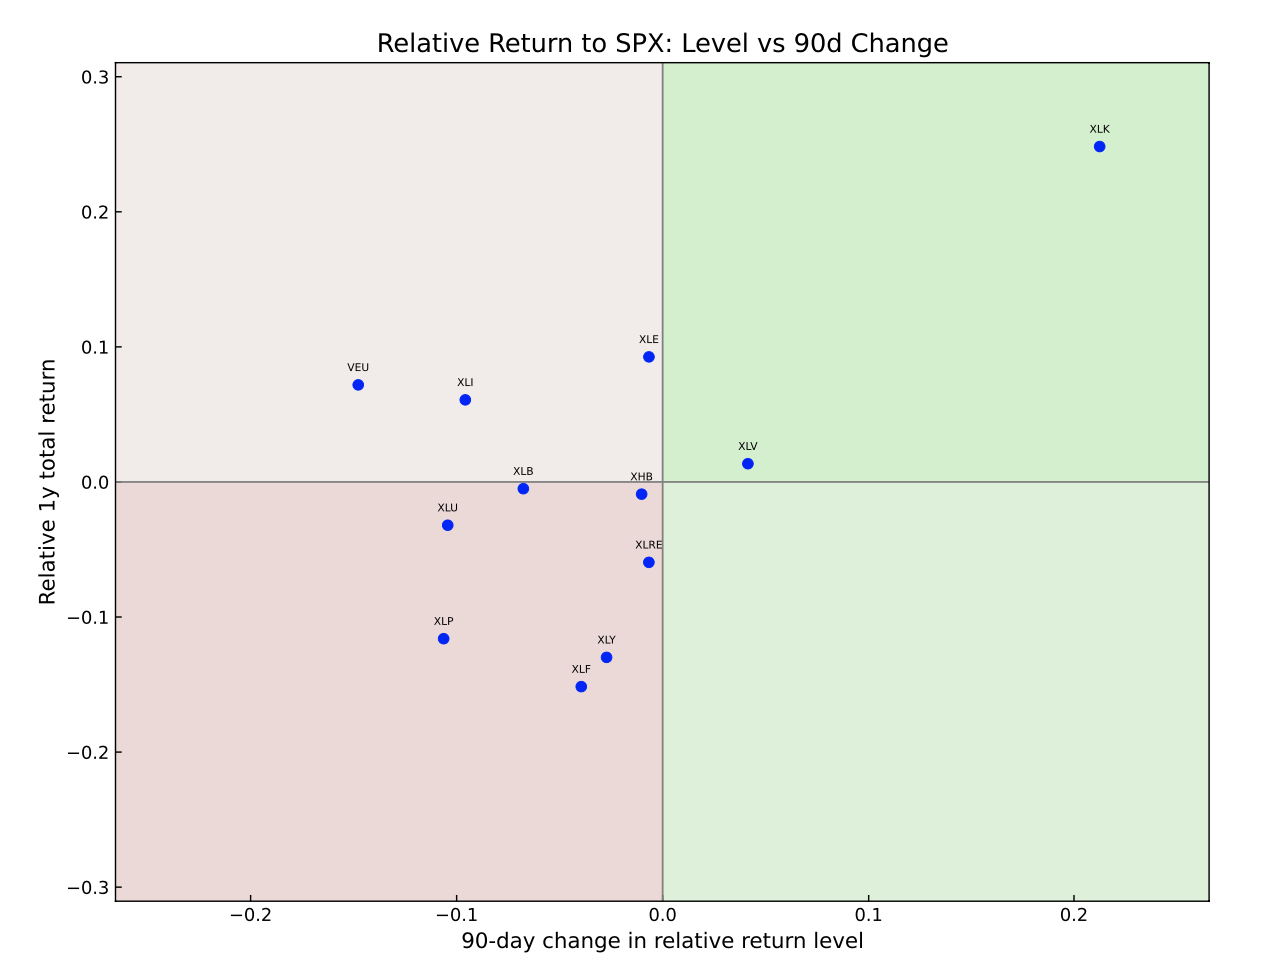
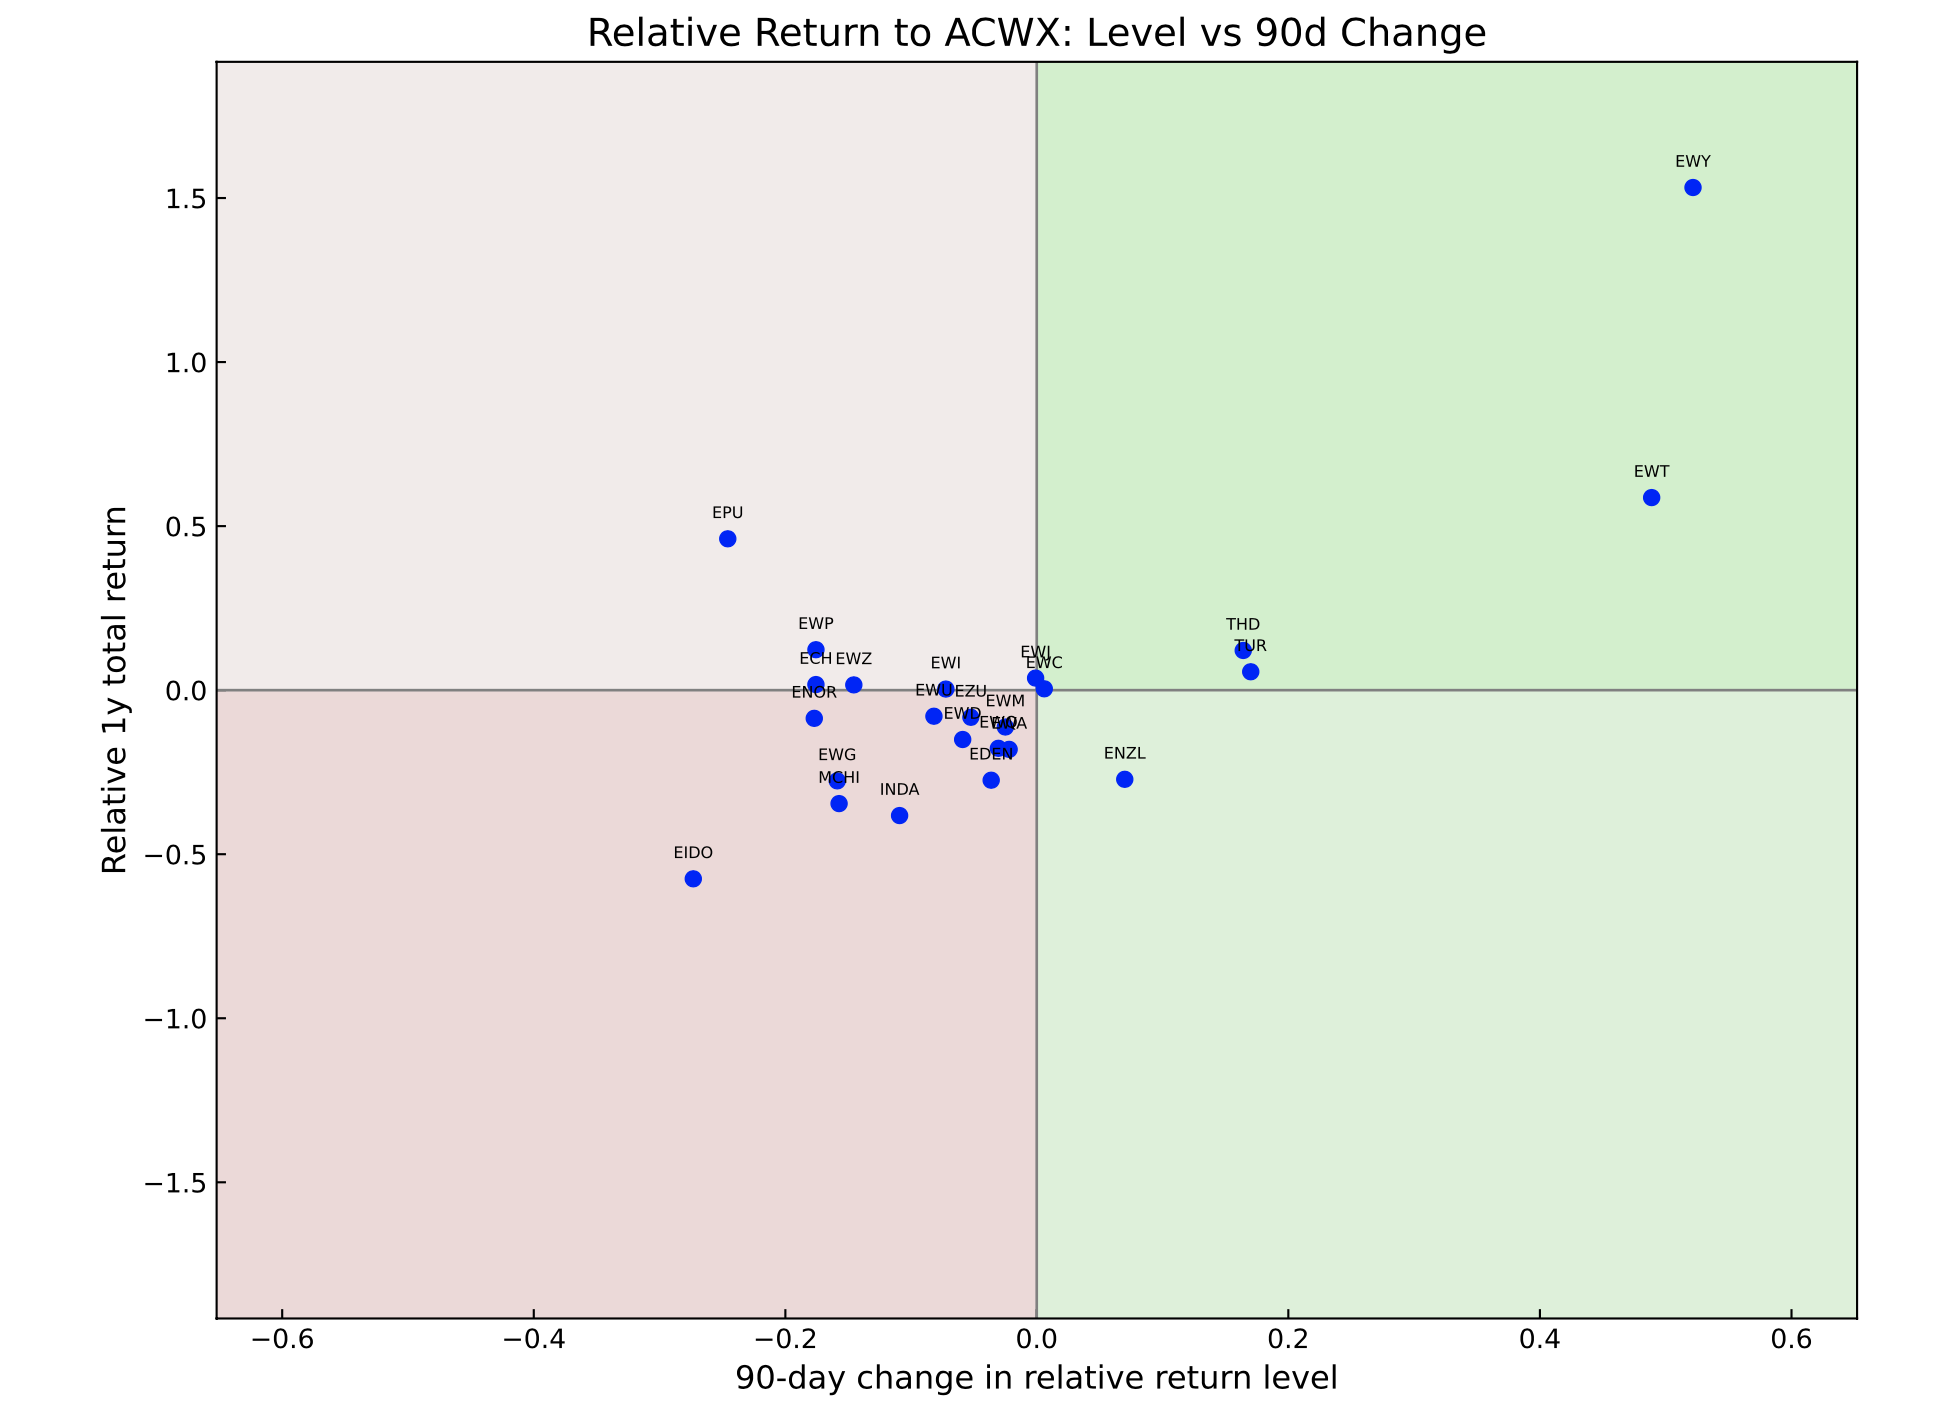
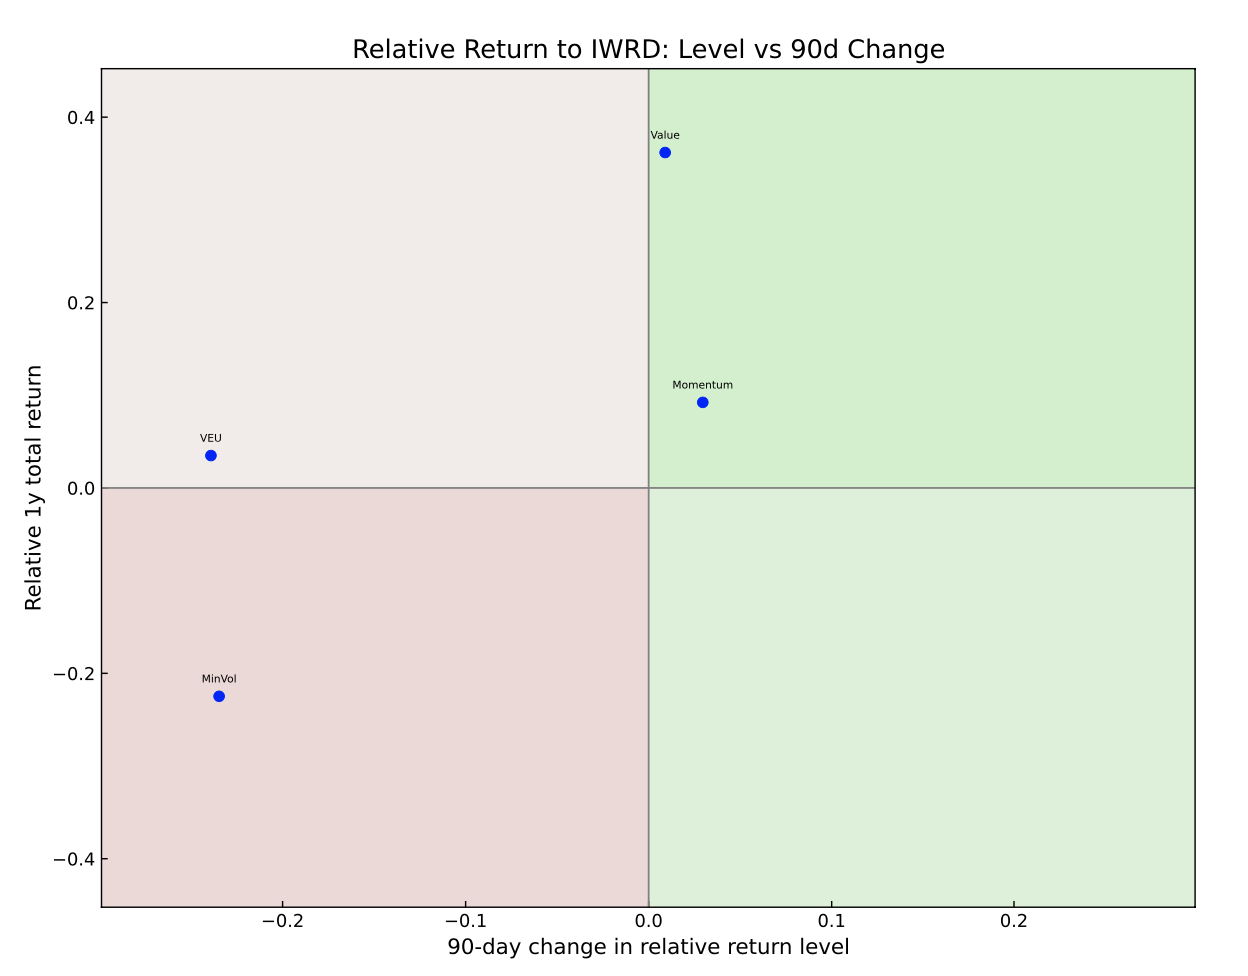
The three charts at the end of this post show the headline relative rotation graphs from each chartbook. In the case of the S&P 500, the underlying sectors—excluding VEU—collectively make up the index itself, or something close to it. In the ACWX ex-US chartbook, by contrast, the benchmark is used to measure the relative performance of country ETFs. For the factor ETF chartbook, I use global equities (IWRD) as the relative-return benchmark. Across all three frameworks, the leaders tell the same story: equity beta has become increasingly concentrated.
Within the S&P 500, XLK (Technology) is pinned to the far right of the rotation graph, with most other sectors so far behind that they cannot even see it. XLI (Industrials) is still holding on to its outperformance but is now losing momentum, while XLE (Energy) has been pushed into the lower-left quadrant—characterised by falling momentum and negative relative returns—following the recent decline in oil prices. VEU (World ex-US) continues to outperform on a trailing basis but is also losing momentum.
Healthcare (XLV), meanwhile, is emerging as a potential surprise leader after a strong run through May and June. A sustained break above $160 would be a bullish development and could signal a contrarian shift in S&P 500 leadership, with healthcare taking on more of the heavy lifting.
The rebound in the relative performance of XLF (Financials) is also worth noting. It is not yet strong enough to register on the 90-day relative rotation charts, but the chart below shows that XLF's relative return is beginning to recover from its recent low. A similar story can be told about XLY (Consumer Discretionary), as the second chart below illustrates. Here, investors are effectively making a bet on the US consumer, despite several macroeconomic headwinds: a historically low savings rate, subdued real income growth caused by higher inflation, and continued pressure on lower- and middle-income households in what has become known as the K-shaped economy. The question is whether these challenges are now fully reflected in valuations across the broader consumer discretionary sector.
For an excellent discussion of the US consumer from the perspective of publicly listed companies across multiple sectors, listen to this episode of The Real Eisman Playbook, in which Steve Eisman speaks with three consumer-sector equity analysts about the current state of the US consumer.
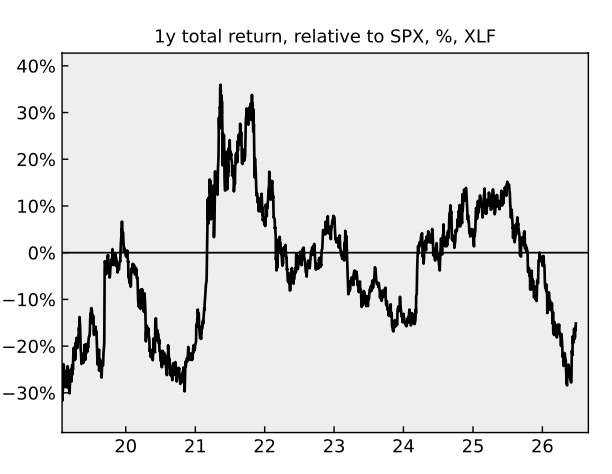
The under-performance of financials is easing…
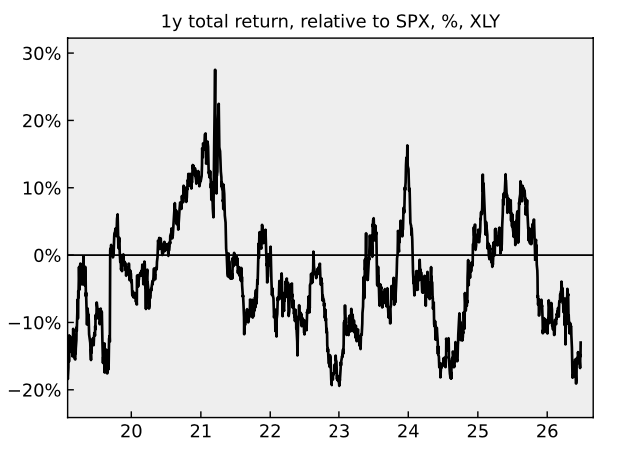
…as is the under-performance of consumer discretionaries
For global equity beta, the dominance of the AI/semiconductor trade is clearly visible in the outperformance of EWT (Taiwan) and EWY (South Korea), both of which sit at ground zero of the AI bull market through their heavy exposure to TSMC, Samsung and SK Hynix.
Thailand (THD) and Turkey (TUR) are also just about holding on to their positions in the upper-right quadrant. Of the two, THD looks like an AI play in disguise. Around 20% of the ETF is allocated to Delta Electronics, a quintessential AI "picks and shovels" business. As a subsidiary of Taiwan's Delta Electronics, the company is a critical supplier of power-management systems and server cooling equipment for AI infrastructure. TUR, by contrast, is a more genuine AI diversifier. Its largest holdings span defence, consumer staples and financials, providing exposure to a broader set of domestic themes rather than the semiconductor supply chain.
Several other markets continue to outperform the ACWX benchmark, albeit with weakening momentum. This includes Peru (EPU) and Chile (ECH), where the story is partly about copper, although Peru's outperformance also reflects the remarkable rally in Credicorp, the country's largest commercial bank and the biggest constituent of EPU. Spain (EWP) also deserves a mention, even though it has begun to lose relative momentum on a 90-day basis. The market has rallied extraordinarily over the past 12 months, driven largely by the strong performance of Banco Santander and Iberdrola.
Most other country ETFs have now collapsed into an indistinguishable cluster in the lower-left quadrant of the relative rotation chart, unable to compete with the leadership of the AI trade. One exception is ENZL (New Zealand), which is beginning to emerge as a potential dark horse with improving 90-day momentum. You would struggle to find a market further removed from the AI theme, making it one to watch if leadership begins to broaden.
More broadly, many country ETFs are now exhibiting deeply negative relative returns, leaving considerable scope for contrarian investors betting on a reversal in thematic leadership. China (MCHI) is perhaps the most striking example, while India (INDA) and Indonesia (EIDO) also stand out in Asia. In Europe, the Eurozone ETF (EZU) likewise remains at an extreme in relative-return terms, although it is now showing early signs of a rebound.
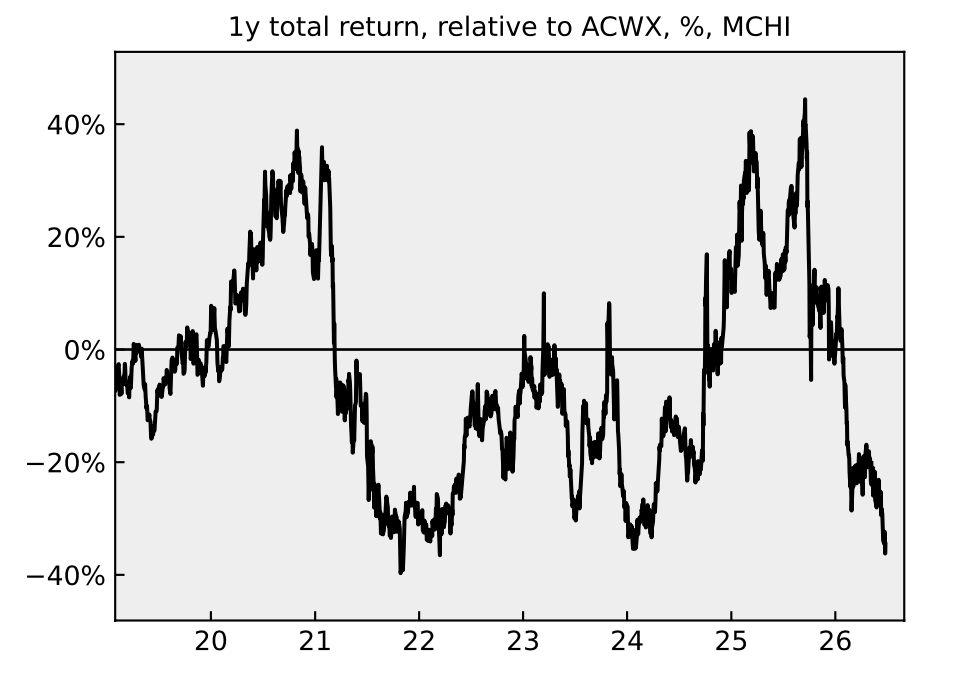
A contrarian signal for Chinese equities?
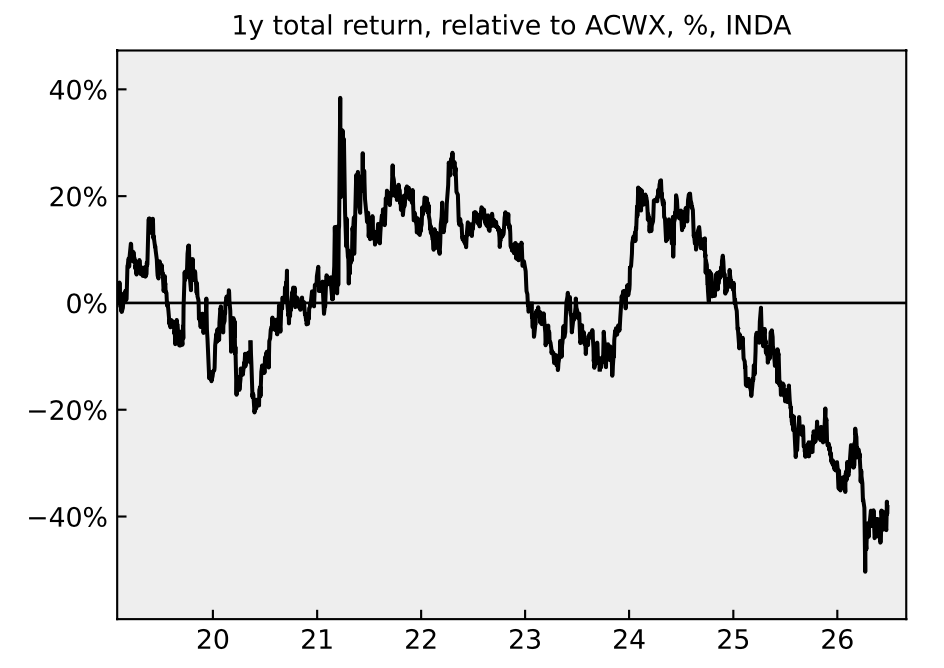
India’s stock market is in a rut, relatively speaking…
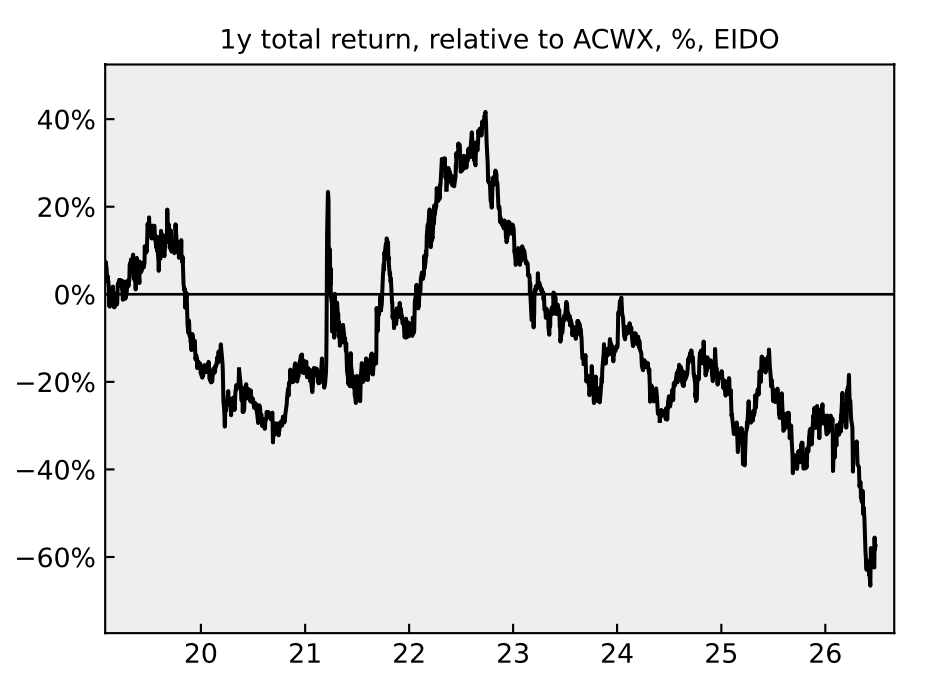
…as is Indonesia
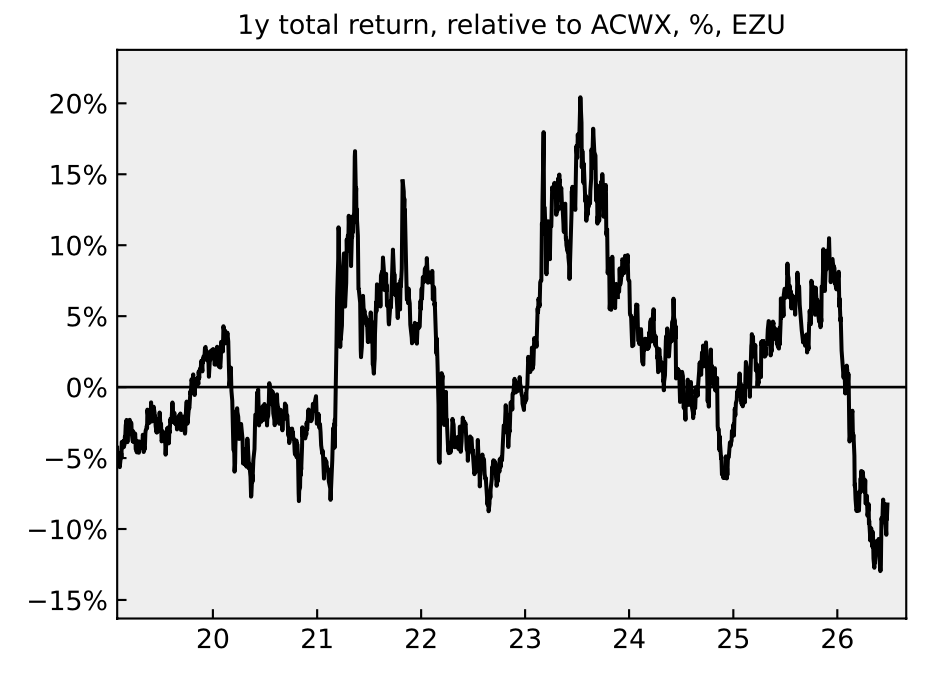
Is underperformance of Eurozone equities coming to an end?
Finally, on the three factor framework the story is crystal clear. Momentum and Value are now effectively the same thing with the relative performance of the min volatility factor now at an extreme. So, if you are unafraid of a setback, stay long momentum and value, but if you worry about a drawdown, the min vol factory currently offers value diversification.