Global Leading Indicators, May 2026 - Danger Danger
The April/May 2026 edition of the global LEI chartbook can be found here. Additional details on the methodology are available here.
I am combining the April and May updates to the LEI Chartbook into a single edition, which, in hindsight, seems like a good decision. Leading indicators showed broad-based weakness in April, but I was sceptical that this deterioration would survive revisions. The May batch, meanwhile, confirms the weakness—and then some. Revisions could still alter the story, but as of May the key message is clear: global LEIs are now on the cusp of a broad-based downturn, having otherwise remained resilient in the face of geopolitical uncertainty and, in particular, volatile US economic and foreign policy.
LEIs also turned down sharply in response to Mr Trump's Liberation Day tariffs, only to snap back as the US president partially walked them back. In the case of the current quagmire in Iran, however, he may find it more difficult to extract himself from the situation. Even if the US president wanted to eat another “TACO”, it is unclear whether Iran would afford him that luxury—at least not on terms remotely acceptable to the White House.
The decline in global LEIs comes at a time when financial markets are grappling with important, and potentially secular, shifts in key trends. In bond markets, investors must now contend with a world in which yet another supply-side shock threatens a sustained rise in inflation, even as the previous inflation shock has barely abated. This raises significant questions about the commitment of developed-market central banks to meeting their official inflation targets, and about their reaction functions more generally. Will they be forced to throw the baby out with the bathwater—Volcker-style—to drive inflation lower? Or will they allow inflation to run hotter? And if so, what rate of inflation will ultimately be deemed acceptable?
For equities, meanwhile, the shifts are equally significant. The post-GFC bull market has accumulated many narratives over the years, but perhaps the most enduring has been the dual drivers of abundant free cash flow and capital-light business models, which funnelled earnings growth into share buybacks and dividends. Add to this a world characterised by excess savings searching for yield, alongside a rising tide of private capital hoovering up publicly listed assets to feed ever-expanding fund empires, and you have a compelling explanation for why the lines on investors’ screens seemed only to move higher.
Many of these secular drivers are now changing.
The AI boom is fundamentally reshaping the very companies that led the market higher over the past decade, transforming them into hyperscalers with an insatiable appetite for capital. First, the free cash flow disappears. Then debt is added to the balance sheet. Now, equity issuance is entering the mix as well, with all three sources of capital expenditure funding seemingly embedded as the industry races towards a finish line it cannot see, and beyond which it has little idea what awaits. The major AI labs are all preparing for multi-billion-dollar IPOs, adding further to the deluge of equity capital required to keep the show on the road, while also facilitating exits for early investors who are increasingly concluding that it may be time to take some chips off the table.
In private markets, meanwhile, the mood is also one of indigestion. The ratio of investors who would prefer to cash out—but have been told that option is not currently available—to new capital entering at the base of the pyramid is beginning to invert. This becomes problematic if you are running a structure in which capital entering at the bottom is integral to funding exits at the top. And for private-equity firms hoping public markets might provide a route to redemption, they are finding that path increasingly congested by the aforementioned deluge of equity issuance from the very companies that were once reliable shrinkers of public share counts.
Investors are already pivoting in two important ways, shunning the so-called software stocks out of fear that the AI revolution will eats its own, devouring the very firms that were meant to benefit from this. More importantly, investors are shifting to the firms that feed the AI capex boom rather than the boom itself.
Anyway, doomer rant over.
All of this is simply to say that some of the most deeply held assumptions and trends in macroeconomics and financial markets are now shifting. History suggests that broad-based cyclical turns in global activity, however mundane—I doubt we are facing a financial crisis—have a tendency to accelerate and expose such structural shifts with greater clarity.
Fraying at the edges
Rolling over
4 out of 20 leading indicators were trending upward in May, down from 8 in April and 10 in March after revisions. This suggests that the surge in global energy prices, and the broader supply-side uncertainty emanating from the US-Iran war, has left a clear mark on global economic activity.
In previous write-ups, I ran simulations pointing to robust forward-looking equity returns over a six-month horizon, given the trajectory of leading indicators at the start of the year. But now we have a war, and LEIs are rolling over; does that change the picture? A little, but not much in a strict quantitative sense. I ran a new simulation capturing previous instances in which my headline global LEI fell by more than nine points over a three-month period, and then recorded the subsequent six-month return of global equities. This yielded a sample of 28 observations, with an average forward six-month return of 3.6% and a win-loss ratio of 18-to-10. Seven of the 18 positive-return episodes generated gains of more than 10%. In short, based on this admittedly mechanical exercise, equity investors with a three-to-six-month investment horizon should be reluctant to panic solely on the basis of the recent downshift in LEIs.
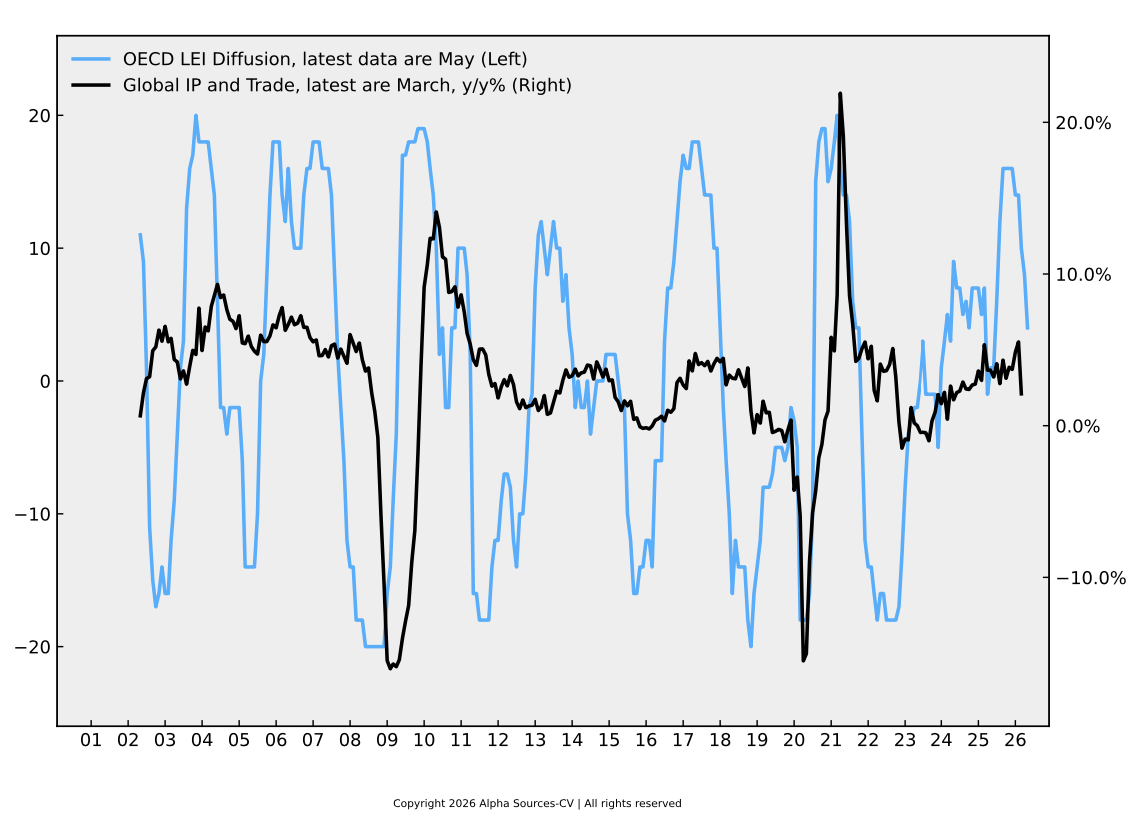
Coincident indicators fell sharply in March as the initial shock from the US-Iran war washed over the global economy. Growth in global industrial production and trade slowed to 2.1%, down from 5.5% in February. Given the usual lead time between shifts in LEIs and movements in global coincident activity, this appears more likely to represent a knee-jerk response to the war and surge in geopolitical uncertainty than a reaction to the easing momentum already evident in the LEIs themselves.
The three-year rolling Z-score of the global LEI—often a reliable early signal of turning points in the global cycle—declined slightly in May, which is an ominous development. That said, history suggests that modest moves in this indicator are frequently revised, so more data are needed before concluding that this gauge has definitively rolled over from a cyclical high.
Equity market returns have been buffeted by headlines surrounding the US-Iran war and the latest earnings season. Corporate results have generally remained strong, but there are now emerging signs that underlying issuance dynamics are beginning to shift against investors, as discussed above.
The first principal component (PC1) of global LEIs remained in a downtrend in May, although its second derivative is beginning to flatten, consistent with evidence that momentum is stalling in headline LEIs. PC1 captures common cyclical patterns across countries and typically peaks during synchronised global downturns. In other words, it tends to turn alongside LEIs themselves. Further evidence of a cyclical turning point would strengthen the case that a broader downturn is now underway.
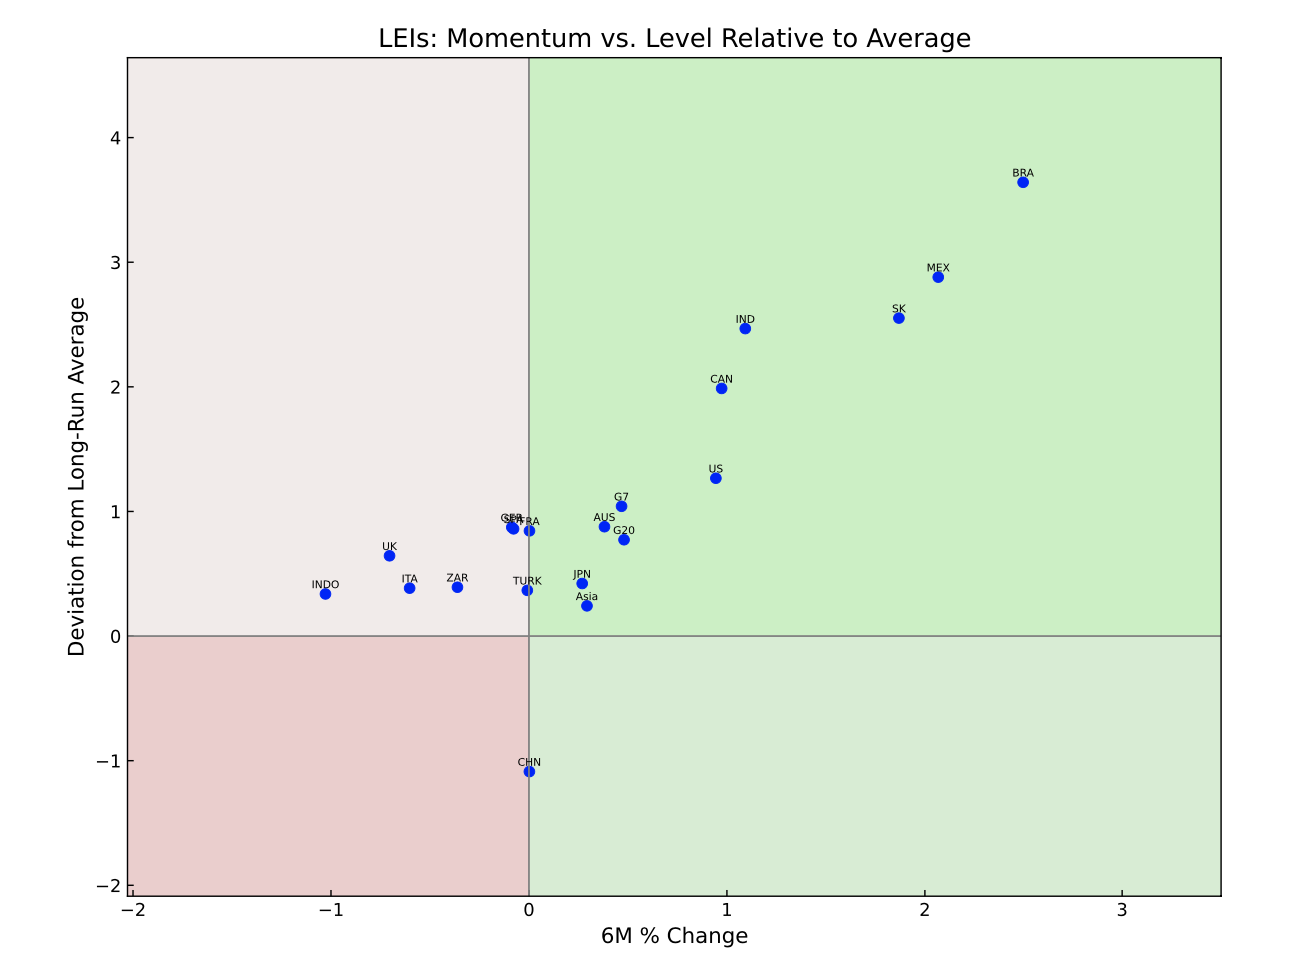
Country-level data generally continue to point to robust underlying momentum in the global economy, with several countries still firmly positioned in the upper-right quadrant. Mexico, the US, Canada, and Brazil stand out as sources of strength in the Western Hemisphere, while South Korea continues to benefit from a technology sector and export base increasingly tied to the semiconductor boom. On the other hand, LEIs in many of Europe's largest economies—including the UK—as well as Indonesia and South Africa, are now slipping. Turkey sits on the borderline. China remains a key contrarian indicator to watch. The Chinese LEI has been consistently stuck in the mud throughout the latest global upswing, but it is now beginning to show tentative signs of improving momentum. Sustained relative strength in China could prove to be a lucrative contrarian opportunity and a rare pocket of resilience if the broader downturn in global LEIs continues to deepen.