Global Leading Indicators, June 2026 - Downturn confirmed
The June 2026 edition of the global LEI chartbook can be found here. Additional details on the methodology are available here.
Global leading indicators deteriorated further at the end of Q2, with revisions pointing to a broadening weakness that has been building since March. This could still reflect the residual effects of the disruptions following the US-Iran war, but the signal is clear nonetheless. A more hawkish tilt in global monetary policy, as inflation risks have resurfaced, has likely contributed to the weakness, alongside uncertainty over the resilience of global consumer spending as real income growth comes under renewed pressure, and a fragile outlook for investment outside AI.
The silver lining is that the accelerated downturn in the headline LEI diffusion index masks increasing divergence across countries, with several key economies still remaining in expansion territory, as shown in the first chart below. The bad news for investors, however, is that—as I explain below—the probability of negative equity returns over the subsequent six months has increased markedly following the LEI diffusion index's recent move below zero.
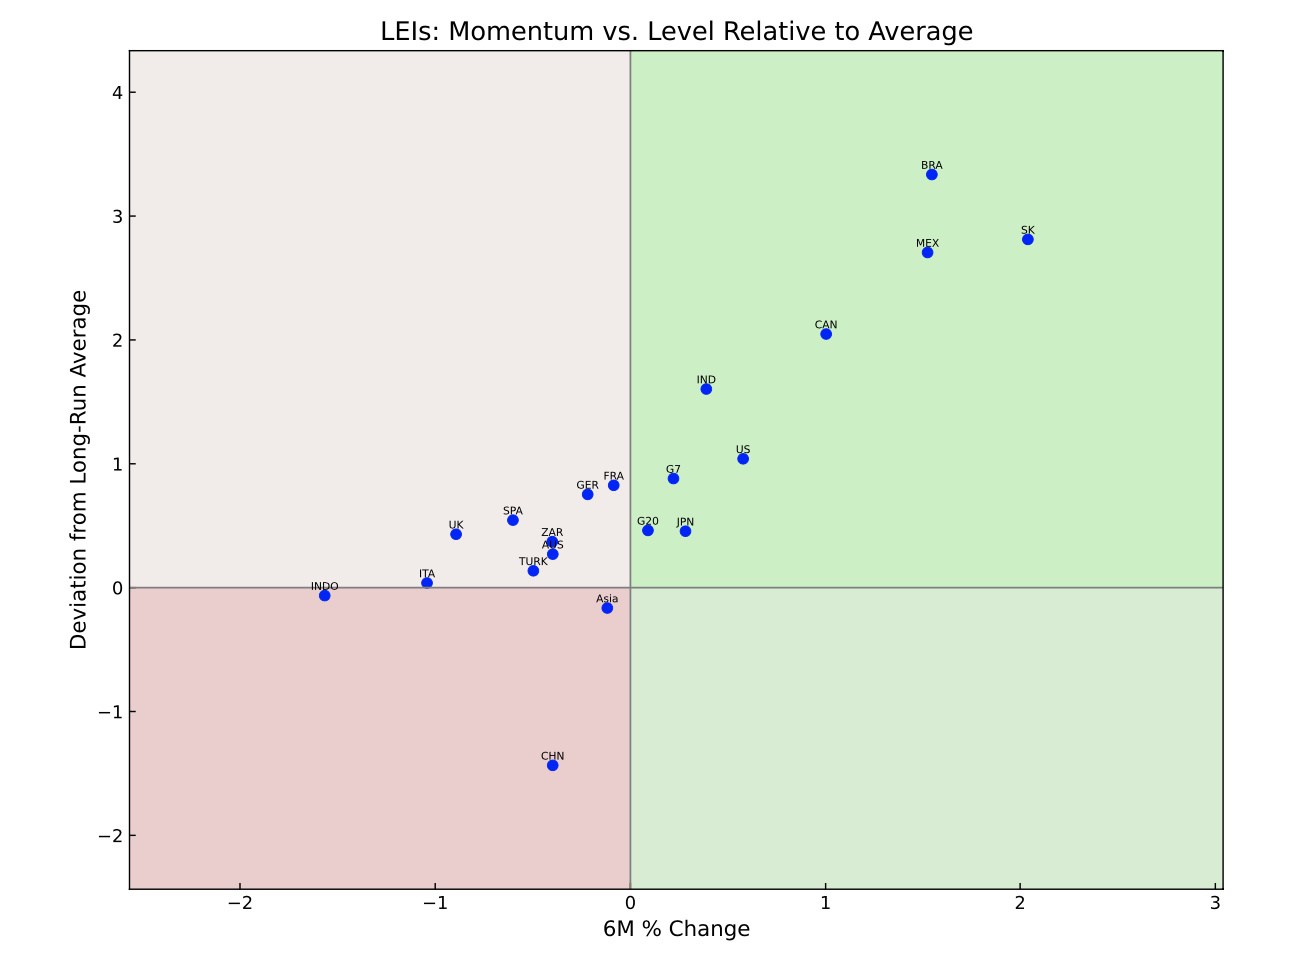
The left tail is getting fatter
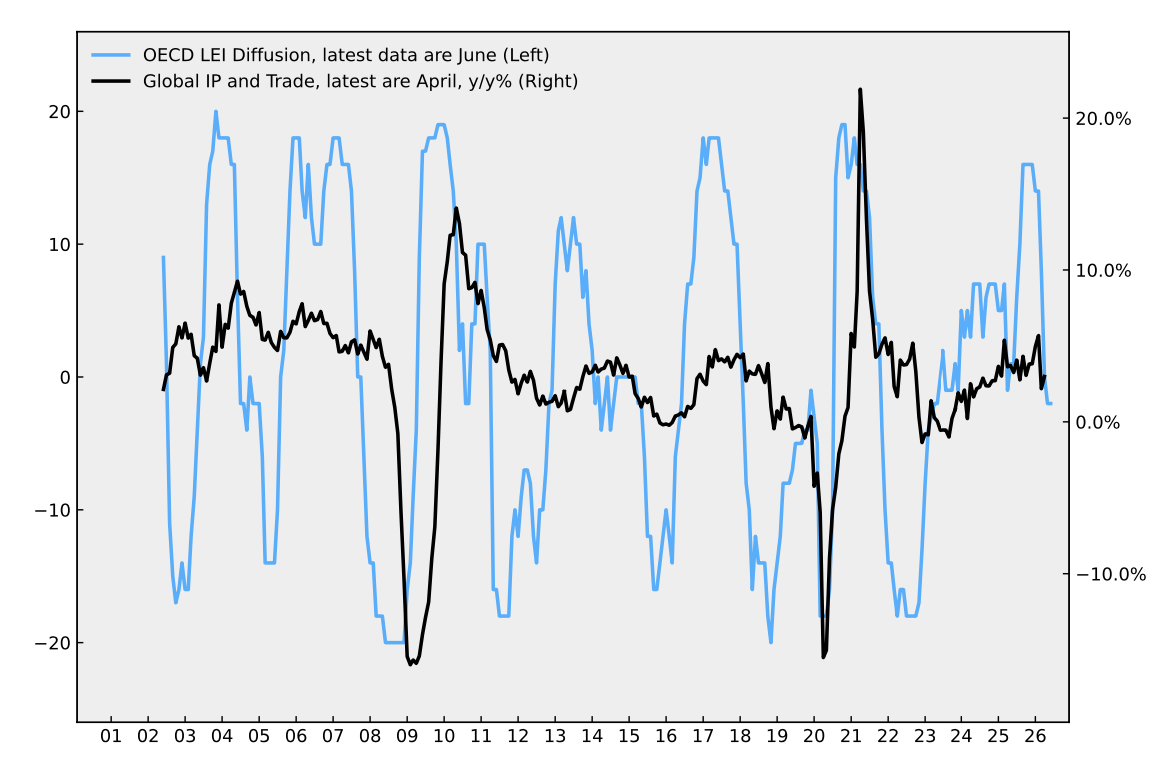
On the cusp of a downturn?
The headline LEI diffusion index was unchanged at -2 in June, following a downward revision to May. This comes after readings of 0 in April, 8 in March, and 14 in February. In other words, the net balance between LEIs that are high-and-rising versus high-and-falling, and low-and-rising versus low-and-falling, has now turned negative. The last time this occurred was in late 2021, marking the start of a prolonged downturn in global LEIs. History suggests that my headline LEI diffusion index rarely recovers from such a position without completing a broader downturn. There was a brief rebound from negative territory in the first half of 2011, although it had little positive impact on coincident activity, which was already rolling over. Likewise, the index largely moved sideways through 2014 and into 2015 before ultimately slipping into another downturn.
In my previous update, I ran a simulation capturing historical episodes in which the headline global LEI declined by more than nine points over a three-month period, and then measured subsequent six-month returns in global equities. This yielded 28 observations, with an average forward six-month return of 3.6% and a win-loss ratio of 18-to-10. Seven of the 18 positive-return episodes produced gains of more than 10%. I concluded that, based on this admittedly mechanical exercise, investors with a three-to-six-month investment horizon should be reluctant to panic solely on the basis of the recent deterioration in LEIs. I have now run a second simulation using the June data, focusing on episodes where the LEI diffusion index falls below zero after being positive two months earlier. This produced nine observations, with an average forward six-month return of 3.2% but a much less favourable win-loss ratio of 5-to-4. In other words, expected returns remain positive on average, but investors should now brace for a materially higher probability of negative returns over the next six months.
Coincident indicators grew by 3.0% year-over-year in April, below the six-month average of 3.9%. Given the typical lead from turning points in LEIs to coincident indicators, we should not expect sustained weakness in global trade and industrial production until after the summer and into year-end, assuming the current downturn in LEIs is confirmed.
The three-year rolling Z-score of the global LEI—often a reliable early indicator of turning points in the global cycle—is now rolling over decisively. It stood at 1.8 in June, marking its third consecutive monthly decline from a peak of 2.1 in March. Previous episodes in which the Z-score rolled over from levels above 2 occurred in late 2003, 2007 and late 2017. Historically, the Z-score has tended to lead declines in the underlying G20 LEI by around three to six months.
Global equity markets have lost momentum in recent weeks, with the headline index moving broadly sideways. The deterioration in global LEIs over recent months points to further downside risks. For a broader discussion of my outlook for global equities, see my recent chartbook updates.
The first principal component (PC1) of global LEIs has begun to edge higher, adding to the evidence that the global cycle is now perhaps on the cusp of a synchronised downturn. PC1 captures the common cyclical component across countries and typically peaks during periods of synchronised global weakness. In other words, it tends to turn alongside LEIs themselves. The recent upturn therefore strengthens the case that a broader global downturn is now underway.
Country-level data provide a more nuanced picture than the aggregate LEI indicators suggest. As the chart above shows, the LEIs of several key economies, including the US, remain in broad-based upturns, with levels still above their long-run averages. The aggregate G20 LEI also remains, just, in the top-right quadrant. Other economies continuing to exhibit positive momentum include South Korea—supported by the AI-driven boom in semiconductor exports and capital expenditure—as well as Mexico, Canada, Brazil, Japan and India. By contrast, European LEIs, including the UK, are now drifting towards the bottom-left quadrant, joining China, which has been locked in a downturn for some time.