Global Leading Indicators, July/August 2026 - On the precipice
The July/August 2026 edition of the global LEI chartbook can be found here. Additional details on the methodology are available here. Remember that the OECD published two months worth of LEI data in September after taking a break over the summer.
Global leading indicators stabilised over the summer, albeit at a weak level, so far dispelling fears that the downturn which began in Q2 marked the start of an accelerated decline in the headline LEI diffusion index into outright negative territory.
The deterioration in global LEIs since March—coinciding with the shock to global energy markets from the US-Iran war—has unfolded against an increasingly stark divergence across financial markets. Equities remain relatively calm, with the rotational tape continuing, while bond markets are closer to panic as a combination of inflation concerns—shifting the outlook for monetary policy—and fears over persistently large fiscal deficits in developed economies pushes yields higher.
The key question is whether this repricing in global bonds ultimately spills over into equities, tightening financial conditions through lower equity prices and, by extension, delivering a further hit to leading indicators. For now, that transmission is not happening. One explanation is that equity markets view rising yields as a natural counterpart to the AI boom: stronger investment is supporting growth while raising expectations for future productivity gains. Add to this the crowding-out of government bonds by surging private-credit issuance to fund the AI build-out, and the coexistence of rising yields and robust equity markets looks less anomalous, for now.
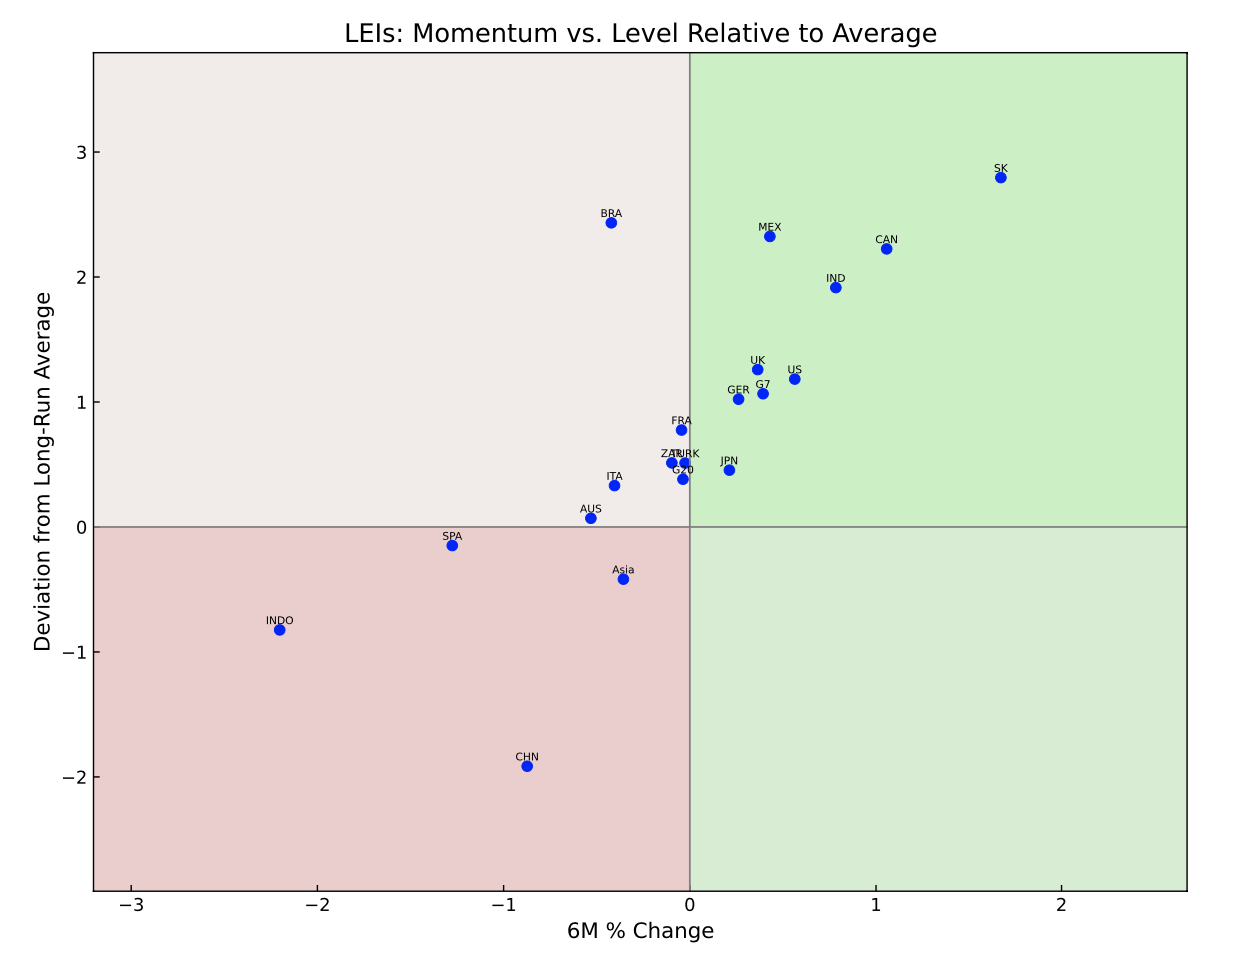
The left tail is getting fatter
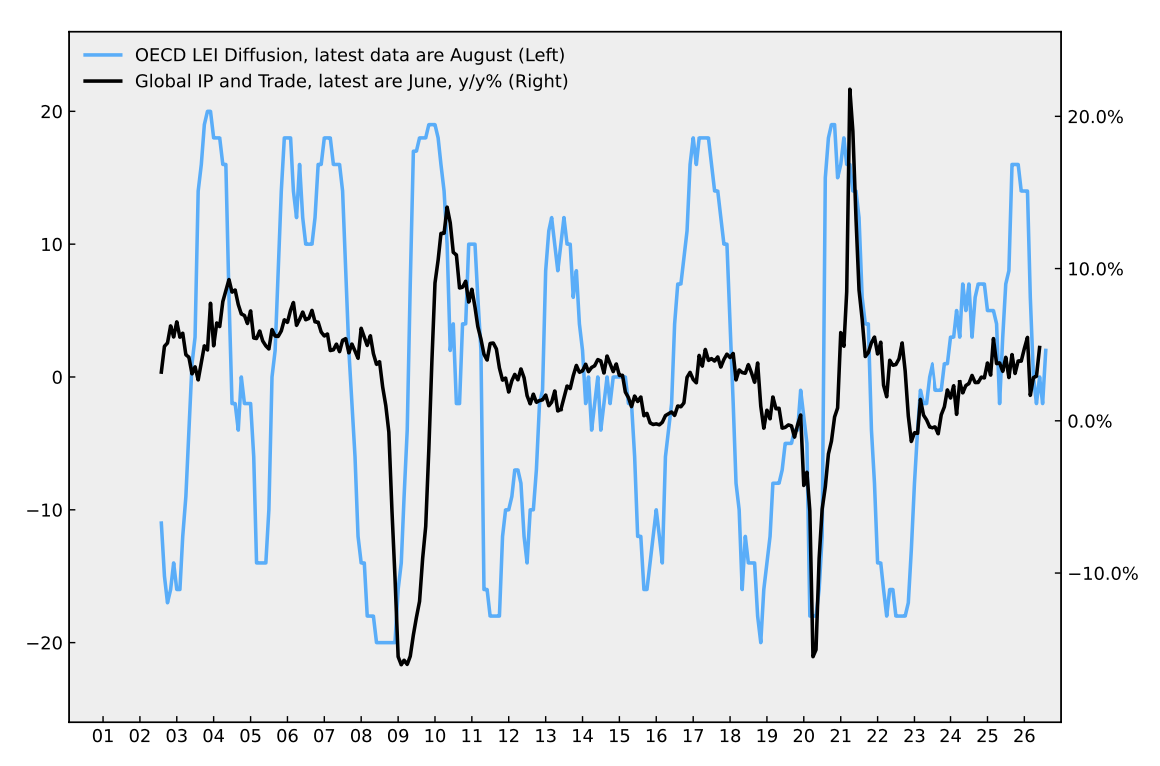
On the cusp of a downturn?
The headline LEI diffusion index—measuring the difference between LEIs with positive and negative momentum—rose to +2 in August from -2 in July, though this looks like noise in an otherwise weakening trend around zero. The latest revisions show that my LEI diffusion gauge deteriorated sharply in March, following the US-Iran war, and has stabilised around zero since. In other words, before the war, net momentum in global LEIs was strong and positive; it is now poised on the precipice of turning negative. The first chart above, which plots the level of the LEI as a function of its six-month change, tells a more positive story, with key economic LEIs still well positioned in the upper-right quadrant.
Coincident indicators grew by 4.8% year-over-year in June, rebounding solidly from just under 3% in the previous two months. Given the typical lead from turning points in LEIs to coincident indicators, we should not expect sustained weakness in global trade and industrial production until the end of year, at the earliest, and perhaps not, at all if the current stalemate in my LEI diffusion index continues around zero.
The three-year rolling Z-score of the global LEI—often a reliable early indicator of turning points in the global cycle—continues to roll over, which remains the main bearish signal in these data. It stood at 1.4 in August, down from 1.6 in July, and has weakened consistently since peaking just below 2.0 in March. Historically, the Z-score has tended to lead declines in the underlying G20 LEI by around three to six months.
In previous updates, I ran simulations to capture expected near-term returns for global equities as a function of the position of LEIs. In my simulation using the June data, I noted that six-month return expectations remained positive with the LEI diffusion index falling to zero, but also that the win-to-loss ratio was close to balanced, pointing to an almost equal probability of negative returns. It is difficult to capture the current trend in LEIs for the purposes of a similar simulation. The current episode most closely resembles the period from early 2014 to early 2015, when the LEI diffusion index was also stable around zero. This eventually gave way to a downturn in both LEIs and global equities from the spring of 2015 through the end of Q3. A sample size of one is not much to go by in making a similar prediction now, but historically it has been rare for LEIs to stabilise after falling from a high without eventually rolling over more decisively. For a more detailed look at global equity trends and US sector momentum, see my latest chartbooks here.
The first principal component (PC1) of global LEIs was beginning to turn higher in the May and June updates, but is now flattening, consistent with LEIs stabilising at a weak level. PC1 captures the common cyclical component across countries and typically rises during periods of synchronised global weakness. In other words, it tends to rebound when LEIs roll over. It is currently sending a broadly inconsistent signal, which is positive relative to the more pronounced evidence of it turning higher in the May and June data.
Country-level data provide a more nuanced picture than the aggregate LEI indicators suggest. The first chart above, which plots the level of the LEI relative to its average as a function of its six-month change, shows that several large economies—including the aggregate G7 leading indicator—are still exhibiting positive momentum. These include the US, Germany, South Korea, Canada, Mexico, India and Japan. On the flip side, the LEIs for Asia, China, Indonesia and, more recently, Spain are now positioned in the lower-left quadrant, exhibiting weakening momentum and levels below their long-run averages.